In response to climate change, governments, industries, and business entities around the world have set out to mitigate their impacts on the environment, in hopes to improve their carbon footprints and hopefully slow down the numerous environmental changes we’re already seeing today.
One way to calculate one’s carbon footprint or environmental impact is to study the Life Cycle Assessment (LCA) of a given product, specifically evaluating the “cradle to grave” for one unit of product.
Here on The Academic Wino, we’ve covered LCAs of various aspects of the wine industry, including the environmental impact of producing a single bottle of wine in Nova Scotia. a two part piece highlighting the environmental impact of the wine distribution chain in the United States (Part I and Part II), as well as the environmental impact of producing natural cork closures. Other studies have shown that producing a bottle of wine results in a carbon footprint of 1.85kg CO2-equiv., with annual emissions of the entire wine sector reaching levels of 40 megatons CO2-equiv (30% of that from viticulture).
One problem with these and other carbon footprint calculations for the wine sector is that they often do not take soil properties into account. Specifically, they ignore soil-carbon dynamics
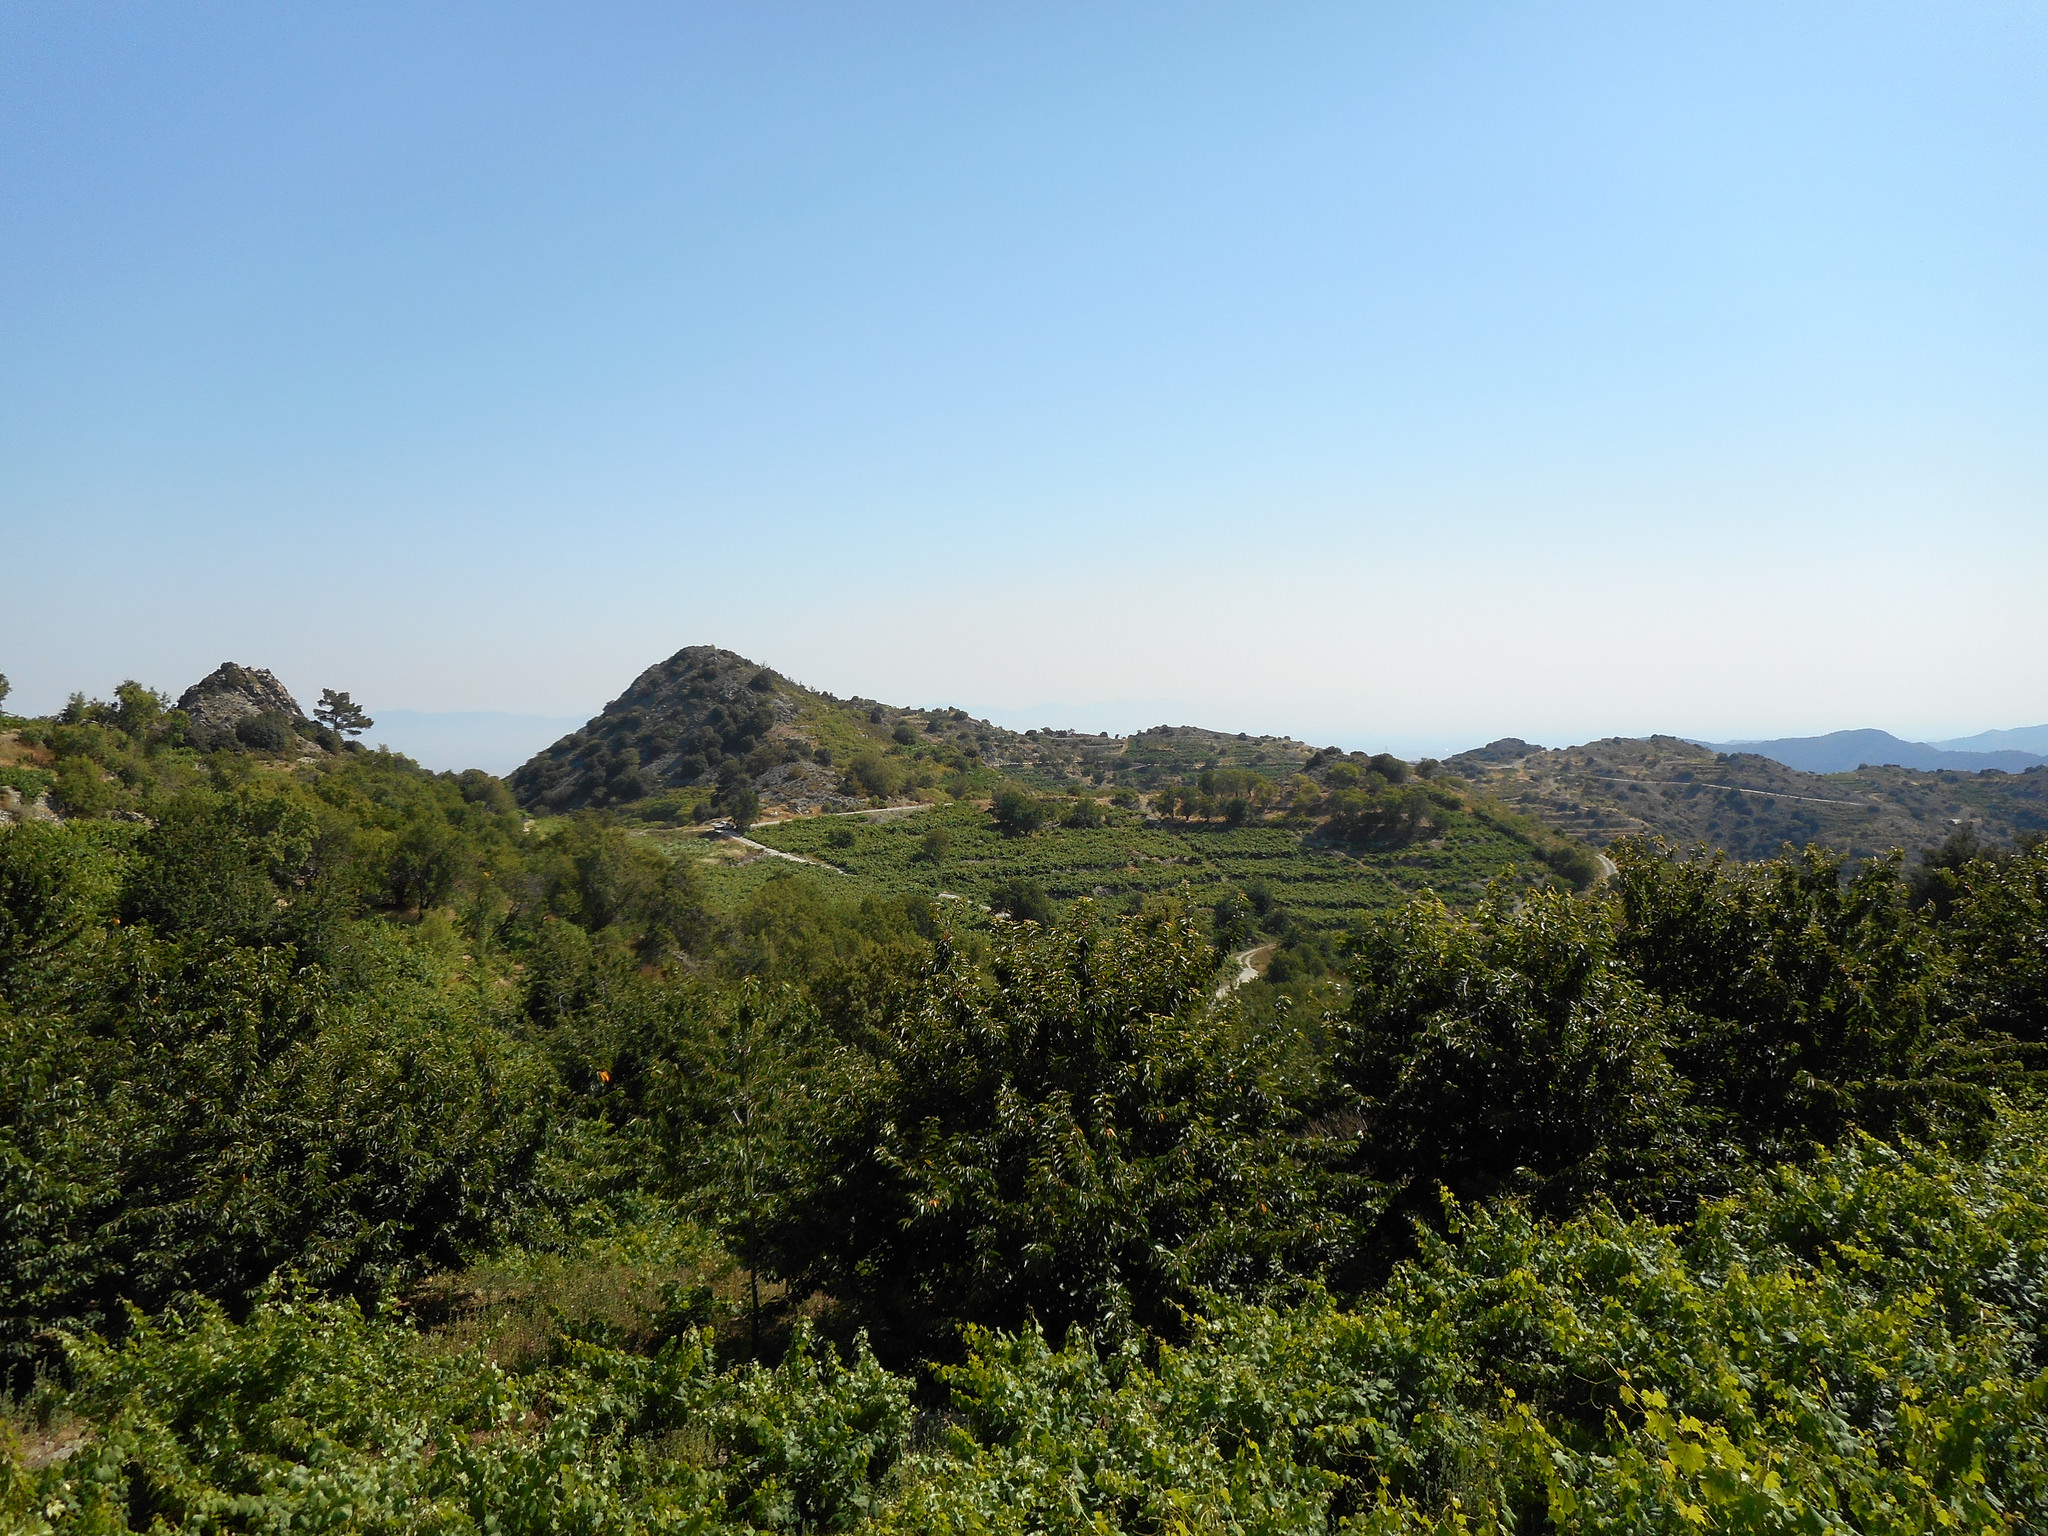
Photo courtesy Flickr user Mike Syrios
and the management of carbon in the soil. Since much of viticulture relies heavily on manipulating the soil in one way or another, be it through fertilizers, pesticides, or other soil management practices, a more accurate measurement of the carbon footprint of wine would necessitate the inclusion of these factors.
There are several ways viticulture (and agriculture in general) can reduce their carbon footprint, including, but not limited to, reducing their reliance on synthetic fertilizers and reducing the number of times the soil is tilled. Additionally, using native species or varieties can also help mitigate carbon footprint, as native species are generally more adapted to the local environment and thus require less manipulations or inputs to achieve the same quality grapes (or other crops) as introduced varieties.
A new study, published online this month in the Journal of Cleaner Production, aimed to evaluate the carbon footprint of three grape varieties: one native, one introduced, and one table grape, on the island of Cyprus (Mediterranean), and to evaluate different ways these carbon footprints could be reduced in an economically feasible manner.
Brief Methods
The grapes studied were:
- Native = Xynisteri
- Introduced = Cabernet Sauvignon
- Table = Soultanina/Thompson Seedless
90 farms participated in this study (30 per grape variety).
In order to calculate LCA/carbon footprint, questionnaires were given to each of the farmers while other agricultural and wine professionals were brought in to validate the farmer’s answers.
The researchers used The Cool Farm Tool (which can be accessed online here) to calculate LCA/carbon footprint using the answers received on the questionnaires. The researchers used the following inputs into The Cool Farm Tool:
- Fertilizers (including the emissions from production and shipment of the fertilizers to the vineyard).
- N2O, NO, and NH3 soil emissions (from nitrogen fertilizers)
- Pesticides
- Crop residue management
- Carbon stock changes in soil after adding manure.
- Field energy use for irrigation, pruning, tillage, pesticide and fertilizer application, and manure transport.
- Transport to and from the farm.
The ‘cradle to grave’ boundaries set in this study were from the vine to the winery/market door.
Selected Results
- The average carbon footprints for the grapes studied were significantly different from one another (Xynisteri < Cabernet Sauvignon < Thompson Seedless):
- Xynisteri (native): 0.283 (+/-0.350) kg CO2-equiv./kg grapes
- Cabernet Sauvignon (introduced): 0.572 (+/-0.580) kg CO2-equiv./kg grapes
- Thompson Seedless (table): 0.846 (+/-0.229) kg CO2-equiv./kg grapes
- The carbon footprint of the Thompson Seedless table grapes was the highest due to increased use of fertilizers, pesticides, and field energy.
- Average yields for the grapes were reported as:
- 4,240 (+/-1,230) kg/ha for Xynisteri.
- 6,800 (+/- 890) kg/ha for Cabernet Sauvignon.
- 11,500 (+/- 2,230) kg/ha for Thompson Seedless.
- The contribution of fertilizers to the carbon footprints for the grapes studied were significantly different from one another (Xynisteri < Cabernet Sauvignon < Thompson Seedless):
- Xynisteri (native): 0.113 (+/-0.194) kg CO2-equiv./kg grapes
- Cabernet Sauvignon (introduced): 0.218 (+/-0.292) kg CO2-equiv./kg grapes
- Thompson Seedless (table): 0.233 (+/-0.081) kg CO2-equiv./kg grapes
-

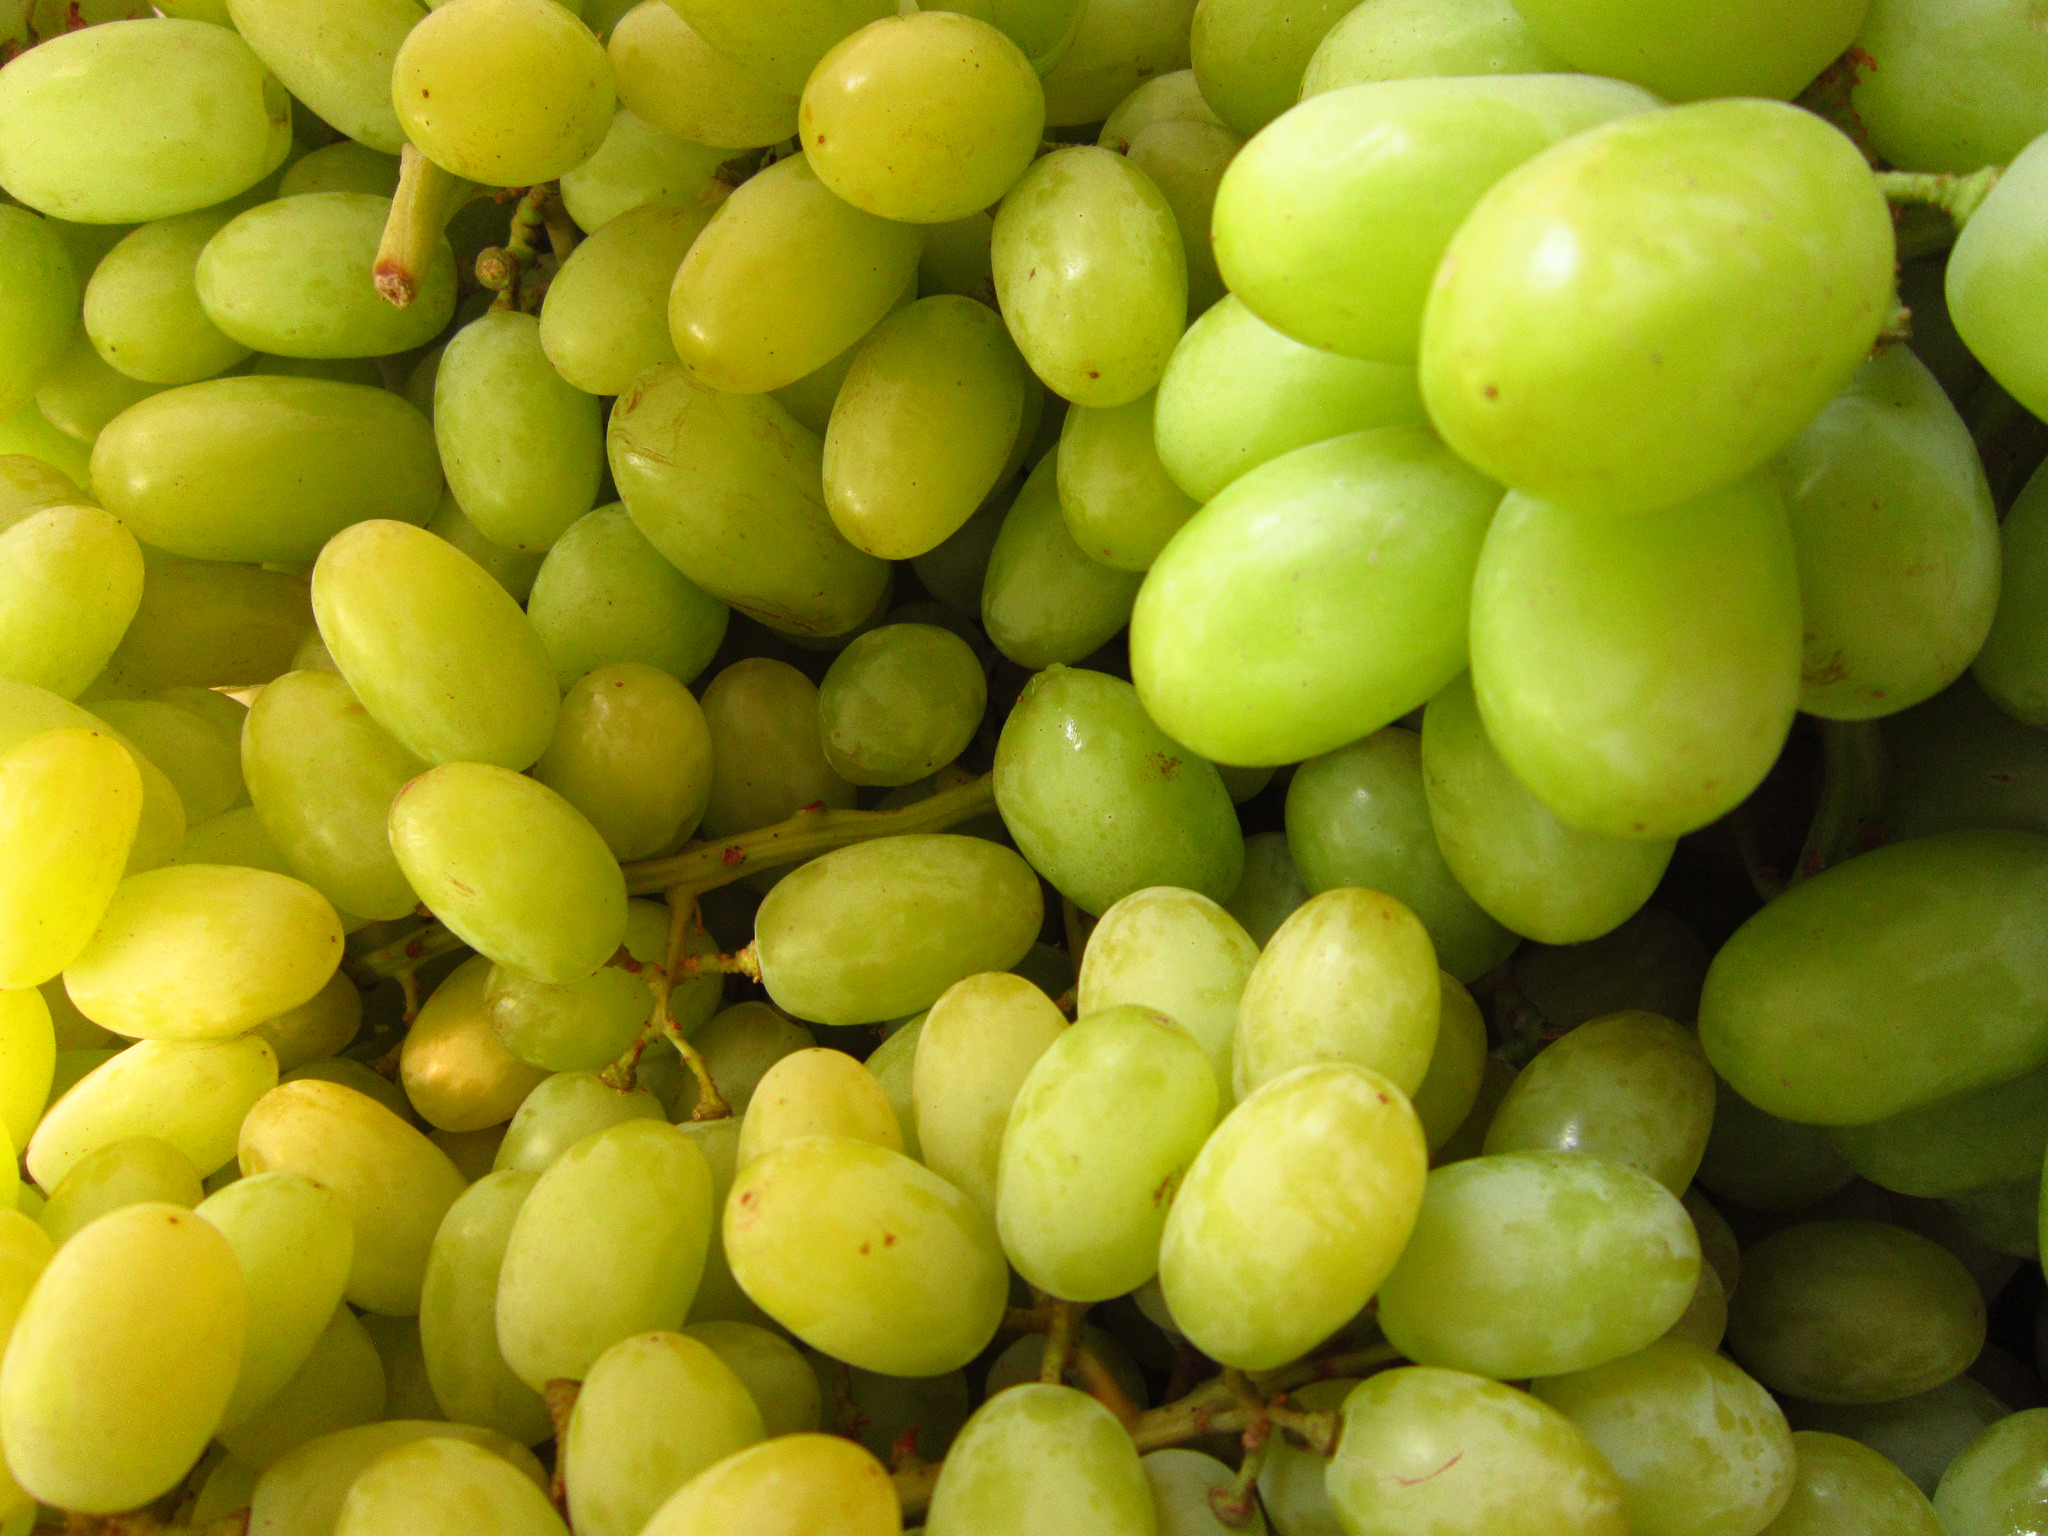
Photo courtesy Flickr user Planeta Agronomico
The contribution of field N2O to the carbon footprints for the grapes studied were significantly different from one another (Xynisteri < Thompson Seedless < Cabernet Sauvignon):
- Xynisteri (native): 0.061 (+/-0.114) kg CO2-equiv./kg grapes
- Cabernet Sauvignon (introduced): 0.159 (+/-0.200) kg CO2-equiv./kg grapes
- Thompson Seedless (table): 0.147 (+/-0.064) kg CO2-equiv./kg grapes
- The contribution of fertilizers and N2O to the carbon footprint of the grapes in this study was the highest of all the inputs, representing 59%, 66%, and 45% of the carbon footprint for Xynisteri, Cabernet Sauvignon, and Thompson Seedless, respectively.
- The contribution of pesticides to the carbon footprints for the grapes studied were significantly different from one another (Xynisteri < Cabernet Sauvignon < Thompson Seedless):
- Xynisteri (native): 0.015 (+/-0.018) kg CO2-equiv./kg grapes
- Cabernet Sauvignon (introduced): 0.028 (+/-0.039) kg CO2-equiv./kg grapes
- Thompson Seedless (table): 0.034 (+/-0.015) kg CO2-equiv./kg grapes
- The contribution of crop residue management to the carbon footprints for the grapes studied were not significantly different from one another:
- Xynisteri (native): 0.039 (+/-0.056) kg CO2-equiv./kg grapes
- Cabernet Sauvignon (introduced): 0.050 (+/-0.064) kg CO2-equiv./kg grapes
- Thompson Seedless (table): 0.048 (+/-0.043) kg CO2-equiv./kg grapes
- The contribution of field energy use to the carbon footprints for the grapes studied were significantly different from one another (Xynisteri < Cabernet Sauvignon < Thompson Seedless):
- Xynisteri (native): 0.034 (+/-0.031) kg CO2-equiv./kg grapes
- Cabernet Sauvignon (introduced): 0.088 (+/-0.055) kg CO2-equiv./kg grapes
- Thompson Seedless (table): 0.343 (+/-0.168) kg CO2-equiv./kg grapes
- It was noted the big jump for Thompson Seedless seen here for field energy use was the electricity required to run the irrigation system.
- The contribution of transportation to the carbon footprints for the grapes studied were significantly different for Xynisteri and Thompson Seedless:
- Xynisteri (native): 0.031 (+/-0.128) kg CO2-equiv./kg grapes
- Cabernet Sauvignon (introduced): 0.026 (+/-0.019) kg CO2-equiv./kg grapes
- Thompson Seedless (table): 0.034 (+/-0.020) kg CO2-equiv./kg grapes
- Total emissions/carbon footprint for the three grapes over the entire region of Cyprus were calculated to be:
- Xynisteri (native): 2,638 kg CO2-equiv./ha
- Cabernet Sauvignon (introduced): 2,848 kg CO2-equiv./ha
- Thompson Seedless (table): 7884 kg CO2-equiv./ha
Scenarios for reducing carbon footprint
- In the questionnaires, the farmers indicated that they would be willing to replace up to 50% of their synthetic fertilizers with local sheep and goat manure, and they would be willing to reduce tillage frequency by one application.
- This scenario adds the following amount of manure for input into The Cool Farm Tool program:
- Xynisteri (native): 3,200 kg manure
- Cabernet Sauvignon (introduced): 7,000 kg manure
- Thompson Seedless (table): 5,700 kg manure
- The new carbon footprints for the grapes studied after reducing synthetic fertilizer use by 50% and replacing with local manure sources, as well as reducing tillage frequency were:
- Xynisteri (native): 0.096 (+/-0.185) kg CO2-equiv./kg grapes: 66% reduction.
- Cabernet Sauvignon (introduced): 0.186 (+/-0.214) kg CO2-equiv./kg grapes: 67% reduction.
- Thompson Seedless (table): 0.507 (+/-0.227) kg CO2-equiv./kg grapes: 40% reduction.
- The reduction in carbon footprints of the grapes were primarily a result of increased soil carbon storage, reduced synthetic fertilizer use, decreased N2O emissions. (Note: field energy actually increased for Xynisteri and Cabernet Sauvignon a little due to the transporation of the manure from the local source to the vineyard).
- Reducing the tillage frequency by 1 application had no effect on field energy use, though did contribute to the increased carbon storage and decreased N2O emissions.
- This scenario adds the following amount of manure for input into The Cool Farm Tool program:
Conclusions
Overall, the results of this study showed that the native grape, Xynisteri, had a significantly smaller carbon footprint than the introduced grape, Cabernet Sauvignon, and the table grape, Thompson Seedless. This is confirmation of what is already known about native versus introduced crops in that native varieties are more adapted to the local conditions and thereby require less manipulations or inputs to produce a quality product.
The results of this study also showed that fertilizer use and N2O emissions were the largest contributors to the total carbon footprints for all three grapes in the study, indicating that this might be a good place to start in trying to reduce the environmental impact of growing grapes.
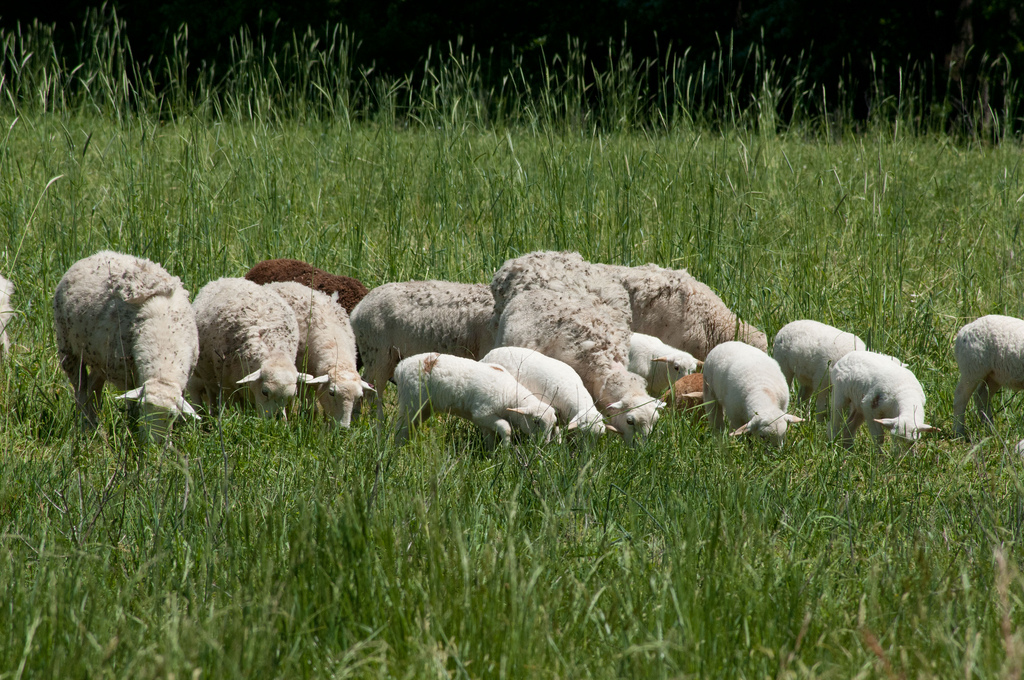
Photo courtesy Flickr user U.S. Department of Agriculture
By swapping out up to 50% of their synthetic fertilizers with local sheep and goat manure, the farmers saw big reductions in their overall carbon footprint (66%, 67%, and 40% for Xynisteri, Cabernet Sauvignon, and Thompson Seedless, respectively). By making one relatively simple change, the farmers were able to significantly decrease the environmental impact of growing grapes. Additionally, not only does using local manure reduce the environmental impact of growing grapes, but it also theoretically reduces the environmental impact of the farms raising the animals that produced the manure, as they would then have less animal waste to process at their own farms.
While the results of this study are very interesting, it is important to note that the results can only be applied to the exact region of study (i.e. Cyprus). Since there are so many inputs and variables when it comes to environmental issues, taking the results of this study and applying them to your vineyard, say, in California or Idaho (or wherever!), could be risky.
Would we see native grapes in all regions outperforming introduced grapes in terms of carbon footprint? What about in wine regions where there are no native grapes? How do all the introduced varieties compare to one another? It’d be interesting to see a meta-analysis on multiple varieties of grapes in multiple wine regions throughout the world.
The reduction of the carbon footprint of grapes simply by reducing synthetic fertilizer use (and replacing it with local manure) is certainly promising as well, though again, since the study was performed in a specific region of the world, the results may or may not be transferable to other wine growing regions of the world. I would be willing to bet that the results would likely be similar in other places, but scientifically I can’t confirm that without seeing actual study results. Perhaps small-scale vineyard tests are in order at your own vineyard (if you can)!
Source:
2 comments for “The Environmental Impact of Growing Native Versus Introduced Grapes”