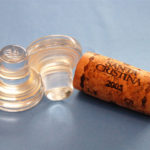
How a winery chooses to close a bottle of wine depends on a variety of factors, from function to consumer perception/marketing. While natural cork closures are the more traditional choice, there has been a lot of technological advancement in the…
How a winery chooses to close a bottle of wine depends on a variety of factors, from function to consumer perception/marketing. While natural cork closures are the more traditional choice, there has been a lot of technological advancement in the…
Despite technological innovations in wine bottle closure systems, natural cork remains the most used closure in the business. It’s also the closure that most consumers associate with “tradition” in wine. Additionally, as you may have read recently, a newer survey…

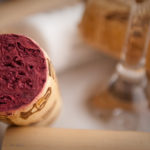
What images come to mind when you think of Champagne? How about another sparkling wine like Cava, Prosecco, or Franciacorta? To many, thoughts of celebration special occasions come to mind, though depending on whom you talk to and where, the…
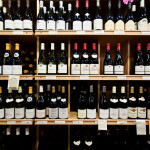
So, you want to buy a bottle of wine. You walk into the wine shop, grocery store, or wherever wine is sold where you live and observe the selection. More often than not, you’re met with aisle upon aisle of…