The following article is my first contribution to the print magazine SOMM Journal. I feel very honored to have been given the opportunity to write for this fantastic periodical and encourage each and every one of you to check it…
The following article is my first contribution to the print magazine SOMM Journal. I feel very honored to have been given the opportunity to write for this fantastic periodical and encourage each and every one of you to check it…
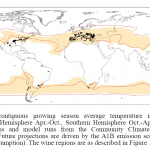
There’s been a lot of talk lately about the effects of climate change on global viticulture, and is something that is imminent and that must be openly discussed. Ultimately, positive actions are required to protect the trade as well as…
Climate change, be it brought on by anthropomorphic sources or the natural cycle of the earth (I’m not trying to start that debate), is continuing to be touted as having a significant influence on agriculture and also viticulture worldwide. Scientists…
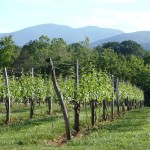
http://blog.selenewines.com/wp-content/ uploads/2009/09/Bare-Merlot-vine.jpg Flavonoids in grapes, particularly anthocyanins and tannins, have great impact on the quality of wines, specifically in the areas of color and astringency. The composition of these compounds in grapes depends on many factors, including grape variety, water…