I’m not usually one to celebrate “International Whatever” Days, but one, in particular, is near and dear to me personally, so I thought I’d take the opportunity to feature a study focused on this one tiny but important organism –…
I’m not usually one to celebrate “International Whatever” Days, but one, in particular, is near and dear to me personally, so I thought I’d take the opportunity to feature a study focused on this one tiny but important organism –…

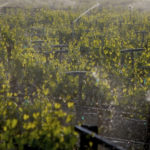
Often when one thinks of how climate change affects the wine industry, images of grape vines scorching under intense heat or being pummeled by ever-intensifying hail storms. One might think of how microclimates around the world are changing such that…
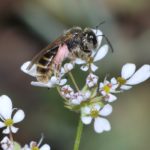
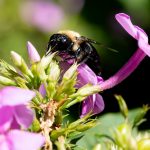
Though grapevines are not insect pollinated, taking care of the worlds’ pollinators, particularly bees (both farmed and wild bees) of critical importance to agriculture and our food supply (in addition to countless other ecological and environmental reasons). In fact, figures…
It’s very difficult, if not impossible, for one single person to thoroughly review every single piece of peer reviewed literature related to wine that is published every day. This Wine Literature Review Lightning Round series presents three new papers (within the past year or…