
This post highlights and summarizes a new research article on how consumers define local wine.
This post highlights and summarizes a new research article on how consumers define local wine.

With the Covid-19 pandemic closing wineries, tasting rooms, and many other businesses, as well as some version of stay-at-home orders being implemented across the country and globe, wineries have been forced to adapt and quickly in order to survive. Consumers…

Often in research settings, you want to control for as many variables as possible, and rightfully so, for statistical purposes. For example, in experiments involving tasting of wine, participants might be placed in isolation booths with minimal external stimuli present…
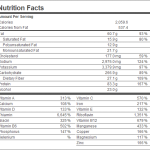
The concept of putting nutrition and ingredient information on food labels is not new, however, in recent years, there has been a lot of pressure to expand these label requirements to alcoholic beverages, including wine. In the EU and the…