Tag Archives: chemistry

Detecting Brettanomyces in Wine: A Novel Approach Using qPCR


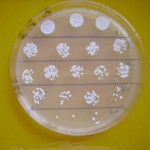
Brettanomyces bruxellensis (also known as Dekkera bruxellensis), or what the wine community lovingly calls “Brett”, is a huge cause of economic decline in the wine business as a result of the yeasts’ ability to decrease the quality of wine on a grand scale, though this fact remains very controversial in the industry.  While many believe that Brett is bad for wine quality, producing ethyl phenols that increase the incidence of “off” aromas in wine (including “barnyard”, “Band-Aid”, “phenolic”, etc), there are few others that believe that Brett character is critical in giving wine individual flavor characteristics and expression of terroir.

Chemically, Brettanomycesyeasts possess hydroxylcinnamate decarboxylase activity and vinylphenol reductase activity, both of which function to convert hydroxylcinnamic acids into the ethyl phenols responsible for “off” aromas and

By Maxdesbacchus (Own work) [GFDL (http://www.gnu.org/copyleft/fdl.html) or CC-BY-SA-3.0-2.5-2.0-1.0 (http://creativecommons.org/licenses/by-sa/3.0)], via Wikimedia Commons

flavors.  In addition, Brettanomycesyeasts are known to be highly polymorphic and have increased mutation rates, making controlling their populations more problematic.

In regards to ethyl phenols, which are produced by the Brett yeasts, the sensory threshold is very low, thus even low levels of these compounds in the wine result in detectable “off” flavors and aromas that often result in a marked decrease in wine quality.  Though the Brett character is often off-putting to some, others find the flavors and aromas desirable and indicative of terroir, which makes the presence of Brettanomyces in wine controversial to say the least.

From a microbiology stand point, monitoring Brettanomyces can be problematic, as the yeast can be difficult to distinguish strain diversity in a population of Brett using current analytical methods, it has a relatively slow growth rate, and it is very difficult to isolate from media and other yeasts.  Another very important and problematic characteristic of Brett is that it can enter what is known as a “viable but not cultivable” state after the addition of sulfur dioxide to the wine.  In other words, Brett is unable to grow under the high free sulfur dioxide conditions, but can continue to grow at a later time after the wine has had some time to evolve.

Unfortunately, Brett detection protocols are sometimes performed during this stage of “viable but not cultivable”, which results in a false negative reading.  To say it another way, the cellar worker is “tricked” into thinking that the winery is sterile, however the Brett is merely just “laying low” and remaining temporarily undetectable using traditional detection methods.  The current methods for measuring Brett are not sensitive enough to detect the yeast when in this stage, thus running the risk of the wine developing Brett character later on when the yeasts “wake up”, so to speak.

A recent study by Tofalo et al (2012) aimed to find a different method for measuring Brettanomyces yeasts in wine, in hopes that a more sensitive method can be utilized and employed in wineries all over the world, potentially saving wineries a financial headache later on.  Specifically, the method tested in this

By Kevin Tong, UC Davis College of Engineering (Ghausi Hall Labs) [CC-BY-2.0 (http://creativecommons.org/licenses/by/2.0)], via Wikimedia Commons

study was a combination approach of qPCR and culture counts, the latter which is the more traditional Brett detection method.  While culture/plating counts can only detect those cells that are cultivatable (thus missing the “viable but not cultivatable” Brettcells), whereas qPCR uses DNA to quantify the number of yeast cells present regardless of their viability or “cultivatabilty” statuses.

Methods (very very briefly)

30 red wine samples were collected from vineyards in central Italy (specifically, the Abruzzo region).  5 of these samples were from organically managed vineyards, while the other 25 samples were from conventionally managed vineyards.  All wine samples were positive for Brettanomyces bruxellensis.

Wine samples were diluted in a serial dilution and plated onto an enrichment medium (designed to isolate Brett).  Yeast colonies were counted after 12 days of 25oC incubation.

DNA was extracted from the yeast colonies using previously performed methods.

qPCR was performed on the DNA samples.

All samples at all stages were performed in triplicate.

Different DNA extraction kits were compared in order to determine which resulted in the highest quality DNA for qPCR analysis.

Results

  • Brettanomyces was not detected in 20 of the 30 wine samples using the plating count method, even though these wines were previously confirmed to be Brett positive.
    • 16 of these samples were from conventional vineyards, and 4 were from organic vineyards.
  • The DNA extraction kit that provided the highest quality DNA for qPCR analysis was the DNAPowerSoil Isolation Kit.  This was the only kit used for further analysis.
    • According to the authors, the results of this kit were “fast, simple, and efficient”.
  • Using qPCR, Brettanomyceswas detected in 22 of the 30 wine samples (as opposed to only 10 of 30 using the plating count method).
    • Concentrations of Brett ranged from 10 to 104 CFU/mL, with organic wine samples harboring the lower concentrations of the bunch.
    • According to the authors, these results indicate that Brett is detectable at levels of at least 10 CFU/mL.

Conclusions

The results of this study indicate that using qPCR instead of traditional plating or culture count methods is superior in regards to detecting Brettanomyces in wine.  The authors noted that qPCR was able to identify 12 more wine samples to be Brett positive than the plating count method could detect.

It is important to note that 8 of the wines still did not give positive results in either the plating method or the qPCR method, indicating that there are more complicated factors “clouding up” the detection of Brett in the samples, questioning whether or not there are potentially even more sensitive assays available that what had been tested in this study.  The authors noted it is very

By Quinn Dombrowski (originally posted to Flickr as Wine) [CC-BY-SA-2.0 (http://creativecommons.org/licenses/by-sa/2.0)], via Wikimedia Commons

difficult to completely isolate Brett from other yeasts, bacteria, or other cells, so it is possible that the cultures of these 8 samples were not completely “clean” and contained other organisms that effectively “hid” the Brettfrom the qPCR.

The authors also noted that different strains of Brettanomyces have different abilities to produce ethyl phenols, thus simply counting the numbers of Brett cells in the wine may or may not be indicative of wine spoilage.  Specifically, a strain of Brett that does not produce much ethyl phenol could potentially be present in very high concentrations and still not spoil the wine, while another strain of Brett that has the ability to produce exorbitant levels of ethyl phenol only needs to be present in small numbers before spoiling the wine it inhabits.

In summary, while there is still room for improvement, this study showed that qPCR may be a more effective way to monitor Brett levels in wine, and may be a good practice for wineries to adopt in their Brettanomyces management protocols.  Certainly, more research needs to be done (i.e. would this method be just as effective in white wines?), but this study provides a more sensitive alternative to the traditional Brett detection methods that could be financially beneficial to wineries.

Source:  Tofalo, R., Schirone, M., Corsetti, A., and Suzzi, G. 2012. Detection of Brettanomyces spp. in Red Wines Using Real-Time PCR. Journal of Food Science 77 (9): M545-M549.

The Effect of Irrigation on the Chemical Composition of Grapes

Every chemical compound in grapes and in wine play some role in the life of the grape/wine, be it during physiological processes during the growth stage, or in the finished wine itself, where it may contribute to the taste and flavor of the wine or the stability of the beverage over time.  For example, anthocyanins are responsible for the color of the grape berries, and ultimately for the finished wine.  Also, flavonols, while they are colorless in the skins of grapes, they are thought to act as a sort of shield against UV radiation.  The exact composition of these compounds in grapes and wine depend on a variety of factors, including grape variety/genetics, environmental factors, and viticulture and winemaking practices.  Studies have also suggested that anthocyanin and flavonol composition is a function of grape growth and skin characteristics.

http://www.environment.gov.au/water/
topics/images/drip-irrigation.jpg

Most research to date has focused on the phenolic composition of grapes and wine, with very little focus on the many remaining chemical compounds in the fruit and finished beverage.  Phenolics should not be the only thing considered during these research studies, as there is likely a synergistic effect between multiple compounds in the system.  Understanding of the full chemical composition of grapes and wines are important not only from a purely scientific standpoint, but also for the grape grower and winemaker due to the direct effects on fruit and wine quality.

The goals of the study presented today were to determine the effect of irrigation management (a viticultural factor that may possibly alter the chemical composition of grapes/wine) on plant yield and physiology, as well as grape berry morphological characteristics, polyphenol and metal composition.  The study also sought to determine the absence of irrigation all together could have an effect on grape quality.

Methods

The experiment was performed in 2008 in a 5 year old vineyard in Montegiordano Marina, Southern Italy.  The climatic conditions there are considered “very hot” (climatic region 5).

The experimental vineyard plot was 0.3ha, with 10 rows of spur-pruned vines trained to a permanent horizontal unilateral cordon.  Distance between vines was 2.5m with 1m between rows.  Final plant density was 4000 vines per hectare.  Rows were planted in a north-south orientation.

Half of the plants were subject to irrigation from the early stages of fruit set to veraison using water amounts equal to 100% of cultural evapotranspiration.  Specifically, this equaled 24L per plant per each irrigation event (10 total) at 5 day intervals.  The other half of the plants were not subject to irrigation.

Meteorological variables that were measured or calculated were: temperature, rainfall, and photosynthetic photon flux density.  Physiological characteristics measured or calculated were leaf-to-air vapor pressure deficit, stem water potential (in order to determine plant water status), leaf gas exchange, chlorophyll florescence, basal florescence yield in dark-adapted leaves, maximal florescence yield in dark and light conditions, maximum quantum yield of PSII photochemistry in dark-adapted leaves, and finally the effective quantum yield of PSII in light-adapted leaves.

At harvest, 30 plants per treatment were randomly selected and the following were measured/calculated: number of clusters and yield per plant, cluster weight, number of berries per cluster, total berry weight per cluster, and the number of leaves per shoot.  For each plant, 3 clusters were randomly selected.

Berries from each cluster were separated into different weight categories: 1) less than 0.60g; 2) between 0.60 and 0.90g; 3) between 0.90 and 1.25g; and 4) greater than 1.25g.  For each plant, 20 grapes per weight class were randomly selected to measure/calculate berry fresh weight, berry diameter at the “equator”, and berry diameter at the “poles”.  The following characteristics were calculated for the berries: surface, volume, surface/volume ratio, the ratio of berry surface/berry weight, and the ratio of skin weight/berry weight.  Skin thickness and soluble solid content of berries was also measured.

For anthocyanin and flavonol extraction and analysis, three clusters per plant were randomly selected and berries separated into the aforementioned weight categories.  Anthocyanins and flavonols were measured, as well as levels of iron, copper, zinc, and calcium.

Results

(Note: I’m leaving out many exact details about values due to space limitations, but if you need to know exact numbers/values of any item presented in the results, just ask and I’ll see if those details are available and will let you know).

  • The growing season was marked with high temperatures and low rainfall.

o   Max temperatures ranged between 15.3 and 38.5oC.

o   Min temperatures ranged from 12.3 and 29.1oC.

o   Rainfall during the experimental growing season was a very low 21.9mm.

  •  There were no significant differences between irrigated and not irrigated plants in regards to net photosynthesis.
  • There were no significant differences in transpiration values between either of the treatments.
  • There were no significant differences in stomatal conductance between either of the treatments.
  • Maximum quantum yield of photosystem II and actual quantum yield of PSII reaction centers in leaves were not affected by irrigation treatment.
  • Mean numbers of clusters per plant were not different between treatment groups.
  • Yield per plant, cluster weight, and total berry weight were significantly different between treatment groups, with higher values occurring in the irrigation group.

o   Irrigation significantly increased the frequency of grapes with greater than 1.25g mass and reduced the frequency of grapes with less than 0.6g mass.

  • Irrigation treatment significantly affected berry fresh weight and skin fresh weight.

o   Irrigation significantly affected berry surface/volume ratios, and were significantly higher in irrigated plants.

o   Skin fresh weights were higher in non-irrigated plants, which resulted in a decrease in skin specific surface and increased in skin specific weight.

o   For the two intermediate weight categories, there were significant differences between the two treatment groups were noted for seed weight per berry as a result in the differences between seed number per berry.

§  There were more seeds in non-irrigated plants than in the irrigated treatment group.

  •  Soluble solid content was significantly higher in the non-irrigated group than the irrigated group.
  • Total anthocyanins were significantly higher in the non-irrigation group than the irrigation group.

o   This result was positively correlated with berry weight.

  • Significant differences were found in the concentrations of petunidin-3-O-acetylglucoside, peonidin-3-O-acteylglucoside, and petunidin-(6-O-caffeoyl)glucoside.

o   Levels were higher in non-irrigated plants (9x, 18x, and 10x, respectively).

  • Levels of single anthocyanins increased with decreasing berry weight.
  • Berries from irrigated plants had significantly lower ratios of acetylated anthocyanins/coumaroylated anthocyanins.
  • Total flavonols were not significantly different between the two treatment groups.

o   Levels of single flavonols were significantly higher in heavier berries.

  • Iron, copper, and zinc levels were significantly higher in berries from irrigated plants than from non-irrigated plants.
  • Calcium levels were not significantly different between the two treatment groups.
  • Metal levels significantly decreased in increasing berry weight.
  • There were no differences in berry skin thickness between either treatment group.
  •  No significant differences were found in the number of skin layers and thickness of the berries between either treatment group.

Conclusions

One undesired outcome of this experiment was the near drought-like conditions of the weather during the experiment.  This resulted in plants being subject to moderate-severe water stress, which caused some leaf necrosis and can influence the micro-climate at the cluster.  Specifically, it has been shown that this type of stress may affect berry size and chemical composition, thereby potentially changing the outcomes of some of the tests, and making it generally more difficult to tease out cause and effect.

The results of this study also showed that total anthocyanins were higher in grapes from non-irrigated plants than in irrigated plants.  This results in a positive influence on the long-term color stability of wines, as these compounds working in concert with tannins and flavonols to strengthen color stability in the aging beverage.  Additionally, increases in these compounds and well as the observed increases in petunidin-3-O-acetylglucoside and peonidin-3-O-acteylglucoside, can have positive sensory benefits to the finished wine as well.

Another interesting result from this study is that metal levels significantly decreased with increasing berry weight.  Excess metal concentrations in wine are known to cause negative sensory characteristics, delay the fermentation process, and increase instability.  Fe, Cu, and Zn were all found to be significantly lower in grapes from non-irrigated plants than in irrigated plants.

Overall, the results of this study suggest that less irrigation increased the quality of the finished wine.  Specifically, little to no irrigation results in lower berry yield and a reduction in berry size without negatively affecting grape quality in terms of the chemical composition of the grapes.  This study confirms what many in the wine industry in that grapes grown under water stress conditions can result in higher quality wine (provided there are no set-backs during the winemaking process).  Even though many already knew less water is better, this study paints a good picture of exactly how the chemical composition of the grapes changes when subject to these drier conditions.

There are many more results to this study that I did not cover due to time and space considerations, but I’d love to hear your thoughts or questions on them, even if I didn’t specifically cover it.  What do you all think of the study?  What would you like to have seen done differently (if anything).  I, for one, would have liked to see them create experimental wines from these two treatment groups and measure the same compounds to see how irrigation actually alters the chemical composition of the finished wine and not just the starting point grapes.  Do these differences carry through the winemaking process?  Are different winemaking techniques better suited to maintaining the original/similar chemical composition of the grapes?

I’d love to hear what you think! Please feel free to comment below!

Source: Sofo, A., Nuzzo, V., Tataranni, G., Manfra, M., De Nisco, M., and Scopa, A. 2012. Berry morphology and composition in irrigated and non-irrigated grapevine (Vitis vinifera L.). Journal of Plant Physiology 169: 1023-1031.

DOI: 10.1016/j.plph.2012.03.007
I am not a health professional, nor do I pretend to be. Please consult your doctor before altering your alcohol consumption habits. Do not consume alcohol if you are under the age of 21. Do not drink and drive. Enjoy responsibly!

Distinguishing Terroir Effects Using NMR and ECVA Analysis

An aside before this post begins….

This is the 100th article reviewed by The Academic Wino!!!  We’ve posted over 130 total posts on this blog, but this one is the 100th peer reviewed article presented!  I can’t believe I’ve read 100 papers so far!  Here’s to the next 100!

http://decanter.media.ipcdigital.co.uk/
11150%7C00000330d%7C3179_wine-fraud.jpg

Throughout the food and beverage industry, particularly in the high-end wine business, fraud is an ever present and serious threat to the authenticity of the product and the industry.  Wine, in particular, is relatively easy to defile, since it is very chemically complex and changes may go unnoticed if not examined thoroughly.  Wine consists of hundreds of compounds that vary depending upon many factors, including but not limited to grape variety, environmental conditions, and winemaking techniques.  All of these combined result in a wine that is unique, and that can be analyzed through several methods to determine its authenticity, including infrared spectroscopy, X-ray absorption, and dielectric fingerprinting.

The primary compounds in wine are formed primary as a result of the alcohol and malolactic fermentations of grape must.  In addition to having good quality grapes, control of the fermentation processes (as well as other steps in the winemaking process) are critical in producing a high quality wine.  To monitor quality of wine during these processes, several methods may be employed, though the use of Nuclear Magnetic Resonance, or NMR. has more recently been investigated as a possible method for doing so. 

Previous studies have shown that by using NMR analysis, they were able to discriminate between grape samples from different environments from different locations in southwest France.  This suggests that NMR analysis may be a successful method for analyzing authenticity and/or quality of wine all the way down to the level of “terroir”; a term which encompasses the specific environmental characteristics of a particular site that all contribute to create a unique finished wine.

The goal of the article presented today was to analyze the winemaking process from wines made in Rioja, Spain by NMR metabolomic fingerprinting and advanced chemometrics to evaluate the chemical differences between specific events during the winemaking process, the vintage, the geographical origin, as well as specific wineries.

Methods

9 winemaking cooperatives were selected for this study, including three from Rioja Baja, five from Rioja Alta, and one from Rioja Alavesa.  Specifically, the cooperatives selected were from Arnedo, Alcanadre, Arenzana de Abajo, Navarette, Haro, San Asensio, Uruñuela, and Labastida.  Vintages studied were from 2006, 2007, and 2008.  Five samples from each cooperative at different time points during the fermentation process were collected.  Time points were 1) before alcoholic fermentation; 2) at the end of alcoholic fermentation; 3) the beginning of malolactic  fermentation; 4) middle of malolactic fermentation; and 5) after malolactic fermentation. 

In total 111 samples were obtained from three vintages, nine winemaking cooperatives, and five fermentation time points.

Nuclear Magnetic Resonance was performed on all wine samples.

Principle Components Analysis (PCA) was performed on the three main wine NMR spectra analyses, separating the samples into three different regions (aromatic region, carbohydrate region, and organic acid region).  Using PCA analysis on the NMR spectra accounts for different types of functional groups (similar molecular compound structures) that help improve chemometric performance (i.e. the ability to extract information from chemical analysis data).

Extended Conical Variable Analysis (ECVA), which functions to determine which region on the NMR spectra is responsible for separation among different groups, was also performed.

Results

  •  The transition from grape must to wine was evident on the NMR spectra as the disappearance of carbohydrate signals in the must and appearance of alcohol and organic acid signals in the wine.

o   The aromatic content during this stage remained constant.

  • In wine, carbohydrates did not completely disappear, but left a complex fingerprint.
Figure 2 from  Lopez-Rituerto et al, 2012.


  • During alcoholic fermentation, the major variation in the NMR spectra between samples was in the ethanol content.
  • During malolactic fermentation, the major variation in the NMR spectra between samples was in malic acid and lactic acid (not surprisingly).
  • When differentiating between subareas inside Rioja, the NMR spectra showed two distinct separations between Rioja Alta plus Rioja Alavesa and Rioja Baja.

o   Rioja Alavesa could not be distinguished between Rioja Alta, possibly due to its very close proximity to the area.

o   The best region in the spectra to distinguish these subareas was the aromatic region, though the PCA analysis was only able to explain 40.2% of the variation.

  • The three vintages studied were distinguished on the NMR spectra using the aromatic region, though not clearly.
  • Using ECVA allowed the researchers to reduce the error rate and misclassifications to 0 or near 0 in all cases.
  • Using ECVA in conjunction with NMR, all three vintages were clearly distinguished.
  • Using ECVA in conjunction with NMR successfully distinguished not only between subareas of Rioja, but also between individual wineries.

o   The two compound signals that showed the clear distinction between individual wineries in Rioja were isobutanol and isopentanol.

Conclusions

The results of this study suggest that isobutanol and isopentanol may be important biomarkers for differentiating wine from individual wineries in a wine region.  Also, different stages of the winemaking process may be effectively analyzed and distinguished using NMR analysis.

Results show that wines can be differentiated using NMR analysis to different time points during the fermentation process, as well as in different subareas of a wine region, and also different vintages.  Combining NMR analysis with ECVA analysis, wines can be distinguished as specifically as the individual winery level.  These results may be very important in distinguishing between wines if needed for authenticity confirmation or fraud investigations. 

This study only investigated one wine region, thereby further studies would be needed in other wine regions to determine if this type of analysis is applicable on a global scale, or if the results are just a regional phenomenon.

I’d love to hear what you all think about this topic!  Please feel free to leave your comments below!

Source: Lopez-Rituerto, E., Savorani, F., Avenoza, A., Busto, J.H., Peregrina J.M., and Engelsen, S.B. 2012. Investigations of Rioja Terroir for Wine Production Using 1H NMR Metabolomics. Journal of Agricultural and Food Chemistry 60: 3452-3461.

DOI: dx.doi.org/10.1021/jf204361d


I am not a health professional, nor do I pretend to be. Please consult your doctor before altering your alcohol consumption habits. Do not consume alcohol if you are under the age of 21. Do not drink and drive. Enjoy responsibly!

The Phenolic Composition of Cabernet Sauvignon Wines in China: Demonstrating Terroir Effects

Phenolic compounds, which are found in grapes, can significantly influence the aroma, flavor, mouthfeel, color, and overall quality of a wine.  These compounds are found naturally in grapes, however can also be synthesized throughout the fermentation and aging processes.  As a result of this, there are many factors that can influence the phenolic composition of a wine, including but not limited to; grape variety, environmental influences, and winemaking techniques.  For wines that are single variety based and not aged after fermentation, the phenolic composition of the wine is highly dependent upon the grape and the conditions in the vineyard. 

Specifically, this is what the term “terroir” embodies: it is the definition of the geographical and environmental origin of the grapes that include characteristics such as soil type, climate, and topography, and who all those things combine to affect the composition and quality of a wine.  Favorable terroir conditions can produce very high quality grapes, which is a critical starting point for a good wine.  By understanding how terroir affects the phenolic composition of grapes, vineyards managers or winegrowers will have a greater understanding of how to manage and maintain the grapevine that will produce high quality wines.

http://3.bp.blogspot.com/_ba7lj8a1Awo/
S_ZUm6jvqII/AAAAAAAANJE/
3d8gtOqRyJU/s1600/china_map.jpg

There is a lot known about terroir effects on grapes and wine throughout many portions of the world, however, there is little known that specifically compares individual phenolic compounds of single varietal wines from different winemaking regions, and even less so known about these effects in the newer wine regions of China.

The wine regions of China are very ecologically diverse, considering they are spread all over the vast country.  The Yunnan Zone can be found at altitudes between 1900 and 2400m above sea level; the Gansu Qilian Zone is located next to a desert; the Ningxia Helan Zone is past the mountains; the Yantai Shandong Zone and Changli Hebei Zone are by the sea; and finally the Huailai Hebei Zone is located in a cooler climate.  It is because of these regional differences that there is great potential for regional terroir effects in wines produced from Chinese grapes. 

The goal of the study presented today was to analyze the differences in phenolic composition in Cabernet Sauvignon vines from different winegrowing regions in China.

Methods

 5 growing regions in China were studied: Deqin of Yunnan (YNDQ); Yuquanying of Ningxia (NXYQY); Yuma of Ningxia (NXYM); Qilian of Gansu (GSQL); Changli of Hebei (HBCL); and Yantai of Shandong (SDYT). 

Cabernet Sauvignon vines were studied, since they are easily found growing in all wine regions of China.  Grapes were harvested at their full-ripened state and were in strict accordance with local wine production technical rules.  Wines went through alcohol and malolactic fermentations, but did not age afterward. 

In each growing region, two to four wineries were chosen and about 1000mLof fresh wine from each winery was collected from at least two different fermentation processes.  To ensure only regional terroir characteristics were at play, all wines from each growing region were pooled.  Each wine sample was studied in triplicate.

Anthocyanin phenolics were analyzed, as well as non-anthocyanins including flavan-3-ols, flavonols, hydroxybenzoic acids, hydroxycinnamic acids, and stilbenes.  Anthocyanins were quantified by using malvidin-3-O-glucoside as a standard, and flavanols, flavonols, hydroxybenzoic acids, hydroxycinnamic acids and stilebenes were quantified by using catechin, quercetin, gallic acid, caffeic acid, and resveratrol, respectively.

Results

Anthocyanins

  • 24 anthocyanins were identified in Chinese Cabernet Sauvignon wines.

o   All 24 were found in each Chinese growing region studied.

  •  Wine from the YNDQ region had the highest levels of anthocyanins.
  • Wines from GSQL and NXYQY regions had significantly lower levels of anthocyanins (due to very low delphinidin derivatives).
  • Cyanidin-3-O-glucoside and peonidin-3-O-glucoside were 5 times higher in YNDQ wines than wines from any other region.
  • Wines from HBCL had the highest levels of malvidin-3-O-glucoside and malvindin-3-O-(6-O-acetyl)-glucoside.
  • There were significant differences in anthocyanin levels between wine regions in China.

Flavan-3-ols

  • 16 flavan-3-ols were found in wines from all Chinese growing regions studied.
  • SDYT region displayed the highest levels of flavan-3-ols.

o   Concentrations in this region were nearly double that of GSQL and YNDQ wines.

o   This region also showed the highest levels of gallocatechin and procyanidin dimers.

  •  Wines from GSQL and YNDQ had the lowest levels of total flavan-3-ols.
  • NXYM wines had the highest levels of epicatechin.

o   These levels were nearly 30 times greater than levels found in YNDQ wines.

  • The highest levels of catechin were found in YNDQ wines.
  • SDYT wines had the lowest levels of catechin.

Flavonols

  • 10 flavonols were found in Chinese wines from the growing regions of study.
  • Highest levels of flavonols were found in YNDQ wines.

o   These levels were nearly 4 times greater than levels found in GSQL wines.

  • YNDQ wines had much higher levels of quercetin derivatives than wines made from other wine regions in China.
  • Higher kaempferol levels were found in NXYM wines.
  • YNDQ wines had the highest levels of dihydroquercentin-O-hexoside, while GSQL wines had the lowest levels.
  • YNDQ wines had higher levels of dihydroquercentin-O-rhamnoside, quercentin-3-O-glucuronide, and myricetin compared to all other regions.
  • Wines from NXYM and YNDQ had higher levels of kaempferol-3-O-glucoside than all other regions.

o   These values were double those found in GSQL and HBCL wines.

Hydroxybenzoic Acids


  •  3 hydroxybenzoic acids were found in Chinese wines.
  • Highest levels of total hydroxybenzoic acids were found in SDYT wines, and the lowest levels in NXYM wines.
  • SDYT wines had significantly higher levels of gallic acid, while NXYM wines had the lowest levels.

Hydroxycinnamic Acids

  • 4 hydroxycinnamic acids were found in Chinese wines.
  • GSQL and NXYQY wines showed the highest levels of total hydroxycinnamic acids.

o   These levels were nearly 5 times more than levels found in YNDQ wines.

  • GSQL wines had nearly 9 times more caffeic acid than YNDQ wines and 5 times more ethyl ρ-coumarate than wines made from NXYM and NXYQY grapes.
  • All wines had the highest percentage of gallic acid to total hydroxycinnamic acids.

Stilbenes

  • SDYT had the highest levels of stilbenes, while YNDQ wines had the lowest levels.
  • Trans-resveratrol was the most abundant stilbene in all wines, though was significantly variable between regions.

o   SDYT wines had nearly 7 times more trans-resveratrol than YNDQ wines.

Regional Similarities

  •  Cluster analysis revealed that wines from the Helan mountain of Ning-Xia (NXYM, NXYQY) and GSQL regions were similar in regards to their phenolic composition.
  • Wines from HBCL and SDYT regions were similar in regards to their phenolic composition.
  • The YNDQ wines were different in regards to their phenolic composition than from all other regions.

Conclusions

According to the results of this study, the differences in phenolic composition of Chinese wines in this study indicate that the accumulation of phenolic compounds in grapes is strongly influenced by terroir effects.  Going further, those regions that were geographically closer to one another had wines that were statistically similar to one another in regards to their phenolic composition than regions that were geographically isolated or further away.  NXYQY, NXYM, and GSQL, all of which were similar in phenolic composition, are all located in the drier area of Western China with a cool-warm climate.  HBCL and SDYT were found to be statistically similar to each other in regards to the phenolic content of wines, and were both located in the wetter areas of Eastern China with a warm climate.  Finally, YNDQ was found to be different from all other regions in regards to phenolic composition of wine, and was located on the plateau valley zone of Southwest China with a warm-arid climate.

Overall, these results clearly show terroir effects, and confirm that different regions in China, like other regions around the world, produce grapes that result in wines with statistically different phenolic compositions.  Terroir effects were found to be similar for wines from the Helan mountain of Ningxia and Qilian of Gansu; for wines from Changli of Hebei and the Yantai of Shandong; and finally with the wines from the Deqin of Yunan having significantly different terroir effects from all other regions.

This knowledge of terroir effects in China should give viticulturalists and winegrowers the knowledge necessary for maintaining and caring for vines from each particular region, as well as giving the winemakers knowledge necessary for creating a high quality wine made from grapes with very specific phenolic profiles.  By applying the knowledge gained from this study, grape growing practices and winemaking techniques may be adjusted accordingly in order to optimize wine flavor/aroma quality in China, at the very least with Cabernet Sauvignon grapes.

I’d love to hear what you all think of this topic!  Please feel free to comment below (any unauthorized html tags will be promptly removed).

Source: Li, Z., Pan, Q., Jin, Z., Mu, L., and Duan, C. 2011. Comparison on phenolic compounds in Vitis vinifera cv. Cabernet Sauvignon wines from five wine-growing regions in China. Food Chemistry 125: 77-83.

DOI:  10.1016/j.foodchem.2010.08.039
I am not a health professional, nor do I pretend to be. Please consult your doctor before altering your alcohol consumption habits. Do not consume alcohol if you are under the age of 21. Do not drink and drive. Enjoy responsibly!