The following is a guest post by David Morrison. Morrison grew up in Australia. He eventually acquired a PhD degree in plant biology, during which he became interested in wine. He started visiting wineries throughout Australia, just at the time when high-quality wineries were beginning to boom. Somewhere along the line he moved to Sweden, and in his semi-retirement he runs a blog called The Wine Gourd (winegourd.blogspot.com). In the interests of doing something different to every other wine blogger, this blog delves into the world of wine data, instead. He is particularly interested in the relationship of wine quality to price, and quantifying value-for-money wines.
One day in Paris, 40 years later…
Forty years ago, on Monday 24 May 1976, 11 wine experts met in a room in Paris to evaluate 20 wines, 10 cabernets and 10 chardonnays. This meeting has become known as the Judgment of Paris, which is a play on words from a beauty contest in Greek mythology, and was used as the title of the first magazine article reporting the results. These results surprised a lot of people — 12 of the wines were from California, and they did very well against the 8 French wines, when tasted blind.
Indeed, when the results were announced 6 weeks after the event, the American media started to make a fuss about this, noting especially that 9 of the 11 judges were French. Some of the media reports claimed, as part of their bicentennial jubilation, that this result proved that US wines were better than their European counterparts. Certainly, this event marks the time from which American wines were taken seriously outside their own country. There is even an entire book on the subject (by George M. Taber, see the reference list), plus a “comedy-drama” movie (Bottle Shock, 2008).
The Paris event is still celebrated by the wine media every 10 years; and there is no reason why this blog should be any different. Indeed, this year the National Museum of

Photo courtesy Flickr user ayako
American History also celebrated the event; the Museum even holds example bottles of the two “winning” wines.
Here, I would like to look at the results of the tasting itself, to see whether they justify any of this fuss. This is not a look at the wines (sadly long gone in most cases), nor their qualities (good or bad), nor their makers, nor their judges, nor their historical influence. The numbers themselves can tell us things; so let’s look at what they have to say.
This topic has been tackled by a number of researchers over the years, and their resulting publications appear in the list at the end of this post. Much of what I have to say here is explained in more detail in those papers.
The most important thing to do with numbers is not to over-interpret them.
After all, if we measure any group of objects then they will rarely all be identical. One of them will have the biggest measurement and one will have the smallest; but does this difference matter in any practical sense?
To take one famous example, in 1942 Reader’s Digest had a laboratory measure the nicotine, tar and resin levels among seven leading cigarette brands. Needless to say, one of the brands had the lowest levels, although the differences between all of the cigarettes were minuscule. Nevertheless, the advertising agency representing Old Gold started a “Guard Your Throat” campaign, claiming that their cigarette brand was now proven to be the best for smokers. This ended in a court case, in which the judge severely criticized the company for deliberately misleading advertising.
We should not make the same mistake here. Clearly, the wines in Paris were given different scores; but we need to ask ourselves whether these differences mean that some of the wines were intrinsically better than any of the others. As Orley Ashenfleter and Richard Quandt have noted (see their paper below):
“The results of any wine tasting will be solemnly reported, with a winner and a loser being declared, without any concern for whether the results would be replicated the next day or for whether there is enough agreement among the evaluators so that any meaningful conclusion may be drawn.”
Evaluating wine is a tricky business, although perhaps not as tricky as driving a car, and certainly not as tricky as performing surgery.
Nevertheless, assigning scores to a set of wines, based on their apparent quality, is not to

One of the judges, Odette Kahn. Photo courtesy Wikipedia
be taken lightly. Indeed, it usually takes quite a bit of training, along with lots and lots of experience, because there is no “gold standard” of best practice for aesthetic judgments.
Of great practical importance, it has been shown repeatedly that human beings are not very consistent at doing this sort of thing. There is therefore a lot of inherent variation in wine scores, and this results from quite a few different sources. For wines, it has been shown that evaluators are not self-consistent, even between wines tasted at the same time, let alone when the same wine is tasted at different times. It is human to be consistently inconsistent!
From this, we do not conclude that wine tasting is useless, although I have seen media reports doing precisely that. Instead, we conclude that variation in wine scores needs to be assessed carefully, to decide whether the variation among scores indicates that some wines are consistently superior to others.
Importantly, like Tweedledee and Tweedledum, the Paris tasting experts clearly agreed to disagree.
Take the red wine that scored the highest average score, the Stag’s Leap Wine Cellars Cabernet Sauvignon. Its scores (out of 20) were: 10, 13, 14, 14, 14, 14, 14, 15, 15, 16, and 16.5. This means that the wine was judged to vary from Passable (10) to Very Good (16). More to the point, only three of the judges ranked it as their best wine of the day, whereas no less than five of them ranked the Château Montrose wine as their best, although it ranked second based on its average score.
At the other end of the scale, the red wine with the second-lowest average score, the Mayacamas Vineyards Cabernet Sauvignon, scored: 3, 5, 8, 9, 9, 9.5, 12, 12, 13, 13 and 14 (representing Undrinkable through to Good). It’s top scores thus overlapped with those of the Stag’s Leap wine; and one of the judges actually gave these two wines the same top score (along with Château Montrose), while another ranked them first and second. Worse still, one of the judges ranked the famous Château Mouton-Rothschild wine first while another ranked it last; and the same thing happened to the equally famous Château Haut-Brion! Overall, eight of the ten red wines were ranked first by at least one person.
A similar general situation applied to the Chardonnay wines in Paris, although it is often conceded that white wines are less complex than reds (fewer tasting components), and therefore they can be tasted more reliably (consistently). For example, the wine with the best average score (the Chateau Montelena Chardonnay) had scores in the range 3-18.5, while the Puligny-Montrachet had scores of 2-17, and the David Bruce Winery Chardonnay had scores 0-11. The latter wine, incidentally, performed consistently worse than the other whites, being the only wine in the Judgment that seemed to be particularly distinct from any of the others (all of the French tasters ranked it last, with scores ≤ 8).
There is an important mathematical consequence of this variation among the judges.
The results of the Judgment were reported as total (i.e. summed) scores for the wines. However, this is inappropriate in the face of variable scoring criteria. Note that I am talking about variation that exists even when the judges entirely agree with each other — each judge has their own internal scale, and these are not necessarily directly comparable. For example, I might say: “This is the best wine I have ever tasted, I will give it 20/20, even
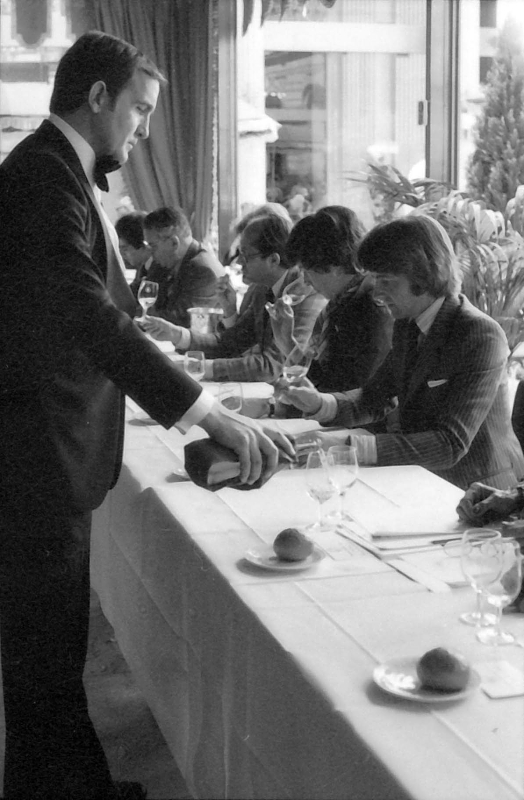
Photo courtesy The National Museum of American History
though it is not perfect”, while you might say: “This is the best wine I have ever tasted, I will give it 18/20, because it is not perfect” — we agree about the quality of the wine, but we still give different scores. This type of difference will give greater weight to those judges who use higher scores, and who thus express stronger preferences in their numerical scaling, because the higher score contributes disproportionately to the total (my 20 contributes more than your 18, so I get more say in the outcome when the scores are summed).
This issue affects in all competitions where human judgment occurs, whether it be for figure skating, ski jumping, gymnastics, singing, or wine tasting; and it certainly mattered in the events of 1976. For example, the scores for three of the assessors covered a range of only 6 points, while four others covered a range of 11-14 points. The latter people thus had a much greater influence on the calculation of the total than did the first three, so that the final sum does not represent a majority decision. This is not “one person, one vote”!
So, we should not talk of wine quality being evaluated on “the” 20-point scale, we should speak of “a” 20-point scale, because each person has their own scale. This lack of a consistent interpretation of wine quality scores produces a simple mathematical limitation, which prevents them being added or averaged in any meaningful way, as I will explain after a bit of background information.
Mathematicians recognize that numbers can represent four different types of information (see Wikipedia).
That is, they can be measured on four different scales, with increasing information content: (1) nominal, in which the numbers simply represent concepts (e.g. telephone numbers); (2) ordinal, in which the numbers represent a rank ordering but nothing more (e.g. Beaufort wind scale, most pain scales); (3) interval, in which the there is an equal difference between the rank-ordered numbers (e.g. degrees Fahrenheit, compass directions); and (4) ratio, which is the same as interval but also zero represents absence (e.g. degrees Kelvin, counts, length measurements).
The problem with adding wine scores, then, is that the data look like they should be interval data, which they would be if everybody used the same scale. However, the inconsistency of interpretation means that wine scores are actually ordinal data only. Interval or ratio data can be added (and subtracted), and ratio data can also be multiplied (and divided), but these mathematical operations do not make sense for ordinal data (or nominal data, for that matter).
Clearly, for wine quality data, calculating the total score for each wine does not mean much. This issue is routinely accepted in sporting events, for example, where scores are adjusted to make them comparable across judges. Some other form of mathematical analysis is thus needed for wine tastings, not just the simple calculation of totals, even though this is sometimes still done to this day. There is a large literature on this subject, although perhaps not much consensus yet (see, for example, the book by Michel Balinski & Rida Laraki).
It is perhaps worth noting here that at the time of the Judgment of Paris the summing of scores may well have been “the normal procedure for wine tastings”, as suggested by George Taber in his book. The first proposal for an alternative procedure for wine tastings appeared in another book in that same year (by Maynard Amerine & Edward Roessler).
Fortunately, there is no disagreement among the researchers who have studied the Judgment results.
They have approached the study from different points of view, and analyzed the data in different ways, but they have all come to the same conclusion, for the tastings of both the Cabernets and the Chardonnays — there was not all that much difference among the wines. Instead, the differences among the judges were much larger than among the wines. Of the 11 judges, it seems that 5 were fairly consistent among themselves as to which wines they thought were high quality, while the other 6 were not, and these two groups provided rather different scores from each other.
The inconsistency of the judges was first pointed out by Frank J. Prial, way back when he reported the event in his Wine Talk column in The New York Times (June 16, 1976). In light of his concerns, he wrote:
“Is such a tasting a valid judgment on the quality of the wines involved? Probably not … Only the most naive reader would conclude anything other than that on a certain day a certain group of French wine specialists agreed that California turns out some fine wines.”
This sentiment has been echoed by all of the experts who have reviewed and reanalyzed the data from the Judgment of Paris — the best that we can claim is that the US wines were generally the equal of the European ones. To suggest that “the California wines bested their French counterparts” (an expression I have seen repeated many, many times, including in George Taber’s book and in the Smithsonian press releases) is thus going a bit too far. Instead, we had égalité, and (hopefully) fraternité.
References
Amerine, M.A., and Roessler, E.B. 1976. Wines: Their Sensory Evaluation. W.H. Freeman.
Ashenfelter, O., and Quandt, R. 1999. Analyzing a wine tasting statistically. Chance 12: 16-20.
Balinski, M., and Laraki R. 2010. Majority Judgment: Measuring, Ranking, and Electing. MIT Press.
Broemeling, L.D 2009. Bayesian Methods for Measures of Agreement. CRC Press.
Ginsburg, V., and Zang I. 2012. Shapley ranking of wines. Journal of Wine Economics 7: 169-180.
Hulkower, N.D. 2009. The Judgment of Paris according to Borda. Journal of Wine Research 20: 171—182.