The following is a guest post by David Morrison. Morrison grew up in Australia. He eventually acquired a PhD degree in plant biology, during which he became interested in wine. He started visiting wineries throughout Australia, just at the time when high-quality wineries were beginning to boom. Somewhere along the line he moved to Sweden, and in his semi-retirement he runs a blog called The Wine Gourd (winegourd.blogspot.com). In the interests of doing something different to every other wine blogger, this blog delves into the world of wine data, instead. He is particularly interested in the relationship of wine quality to price, and quantifying value-for-money wines.
There is a constant stream of discussion about wine reviewers, and their activities. The wine reviews themselves, however, tend to consist of one of only two things: word descriptions and / or numerical scores. I have recently listed a few other approaches to reviewing wine (If not scores or words to describe wine quality, then what?), but none of these have really caught on.
The main issue with wine-quality scores is that they give the illusion of being mathematical without having any useful mathematical properties. This is unfortunate, because the apparent precision of the numbers gives an illusion of accuracy. Potentially useful mathematical properties include objectivity and repeatability. However, objectivity does not apply even for supposedly objective and repeatable scoring schemes, like the one developed at the University of California Davis, since the scores are an amalgam of disconnected sub-scores. However, the main issue is lack of repeatability, especially between tasters. This causes confusion, because people naturally interpret numbers by comparing them to other numbers. After all, 5 apples is 5 apples no matter who counts them; but this simple mathematical property does not apply to wine-quality scores.
The main issue with word descriptions of wine, on the other hand, is the ambiguity of languages, compared to the use of a mathematical language (see my post Are words better than numbers for describing wine quality?).
Ambiguity creates a number of limitations, including: imprecision, so that we cannot evaluate the wines; non-uniformity, so that we cannot compare descriptions; and impracticality, due to flowery or pompous wording (eg. see The noble art of wine pretension).
One response to this situation has been the development of formal tasting sheets, where we simply tick the boxes or choose from among a pre-defined list of words; but professional wine commentators eschew such artifices.
This has lead some people to try to quantitatively investigate the actual degree of uniformity and precision among wine descriptions by professional commentators. The one I will discuss here is:
Bernard Chen, Valentin Velchev, James Palmer and Travis Atkison (2018) Wineinformatics: a quantitative analysis of wine reviewers. Fermentation 4: 82. [www.mdpi.com/2311-5637/4/4/82] (PDF download)
This paper is interesting because it represents an attempt to tackle a fairly tricky problem — turning words into numbers.
The authors have chosen to give their general approach the new name Wineinformatics, because they have taken on the challenging task of trying to quantitatively evaluate word descriptions of wine. This type of language processing is relatively new — previous work has obviously focused on mathematical analysis of numbers. This is why we developed the mathematical language in the first place, because quantitative analysis is then relatively easy. Trying to extract quantitative information from a set of words in any meaningful way is orders of magnitude more difficult.
The authors have been tackling this problem for the past few years, applying various techniques from the field of Data Mining to wine sensory reviews. They have now produced a “brand-new dataset that contains more than 100,000 wine reviews”, derived from online reviews produced for the Wine Spectator magazine. In this new paper, they have used this dataset “to quantitatively evaluate the consistency of the Wine Spectator and all of its major reviewers”.
That is, do the reviewers use the same words to describe wines that get the same quality scores?
Methods
The approach to turning words into numbers is based on what the authors call the Computational Wine Wheel. In essence, this tries to find words held in common between the written reviews, while taking into account that many words are nearly synonyms.
The idea, then, is to group possible synonyms together, representing a single concept. For example, the expressions “high tannins”, “full tannins”, “lush tannins” and “rich tannins” could all be grouped as Tannins_High. All reviews that contain any of these individual expressions would then be scored as possessing this single general concept.
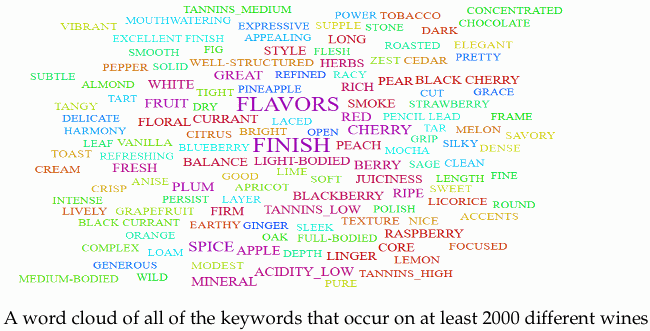
This approach reduces the individually worded reviews from their unique form into a standardized form. The end result is a binary matrix showing the presence or absence of each of the pre-defined concepts for each of the reviews in the dataset — some of the concepts are shown in the following word cloud. The 107,107 reviews in the dataset cover the years 2006–2015, including all wines with a quality score of 80+. There were 10 reviewers in the dataset, although one of them (Gillian Sciaretta) had only a small number of reviews (428) and was thus excluded from the analysis.

The dataset was divided into two categories: wines with a score of 90+ and those wines with 89- (wines that score 90+ are considered as either “outstanding” or “classic” by Wine Spectator). The idea of the data analysis was to find out whether the 90+ wines have any consistency in their descriptions (ie. the same words are used) compared to the 89- wines. Amusingly, for the single wine presented as a worked example, the wine score unfortunately changes from 95 (before processing) to 90 (after processing)!
Two different classification approaches were compared: naïve bayes, and support vector machine. The difference needs not concern us here, but the general approach in both cases was to choose a subset of the data (say 20%) and “train” the classification algorithm to distinguish 90+ wines from 89- wines, based on the word concepts. Then, this newly trained algorithm is asked to “predict” the quality score (either 89- or 90+) of the remaining subset of the data (the other 80%). The resulting predictions are then compared to the known scores of that second subset. If the predictions match the known scores, then the training was successful; and we may then conclude that the reviewer was consistent in their descriptions.
This processing is all very standard in data mining, and it produces four measures of reviewer consistency:
- accuracy — proportion of all predictions that are correct
- precision — proportion of the 90+ predictions that are correct
- sensitivity — proportion of the 90+ wines that are predicted correctly
- specificity — proportion of the 89- wines that are predicted correctly.
Results
The results consist of a couple of lengthy (and boring) tables showing the four consistency measures for each reviewer for each classification method, some of which is then repeated as figures.
The two analysis methods turned out to differ somewhat, but were nevertheless in general agreement, meaning that the results did not depend on the details of the data analysis. This is a good thing.
The accuracy and specificity were usually in the range 0.80–0.95, with the precision and sensitivity in the range 0.65–0.75. The latter proportions are quite mediocre; and this results from the fact that the vast majority of wines had scores below 90, which is the “false prediction” category for the data analysis. This makes it hard for the algorithms — they have to predict far more 89- wines than 90+ wines, but their success is based mainly on the 90+ wines; this is like running 20 miles but being judged only on your speed over the last mile.
This bias in the data is clearly a serious limitation of the experimental design, but not one that is easy to address — there will always be more wines of 89- quality than 90+. Any attempt to subsample from the wines, to balance the two groups, will reduce the power of the data analysis, and it also risks creating unintended further biases.

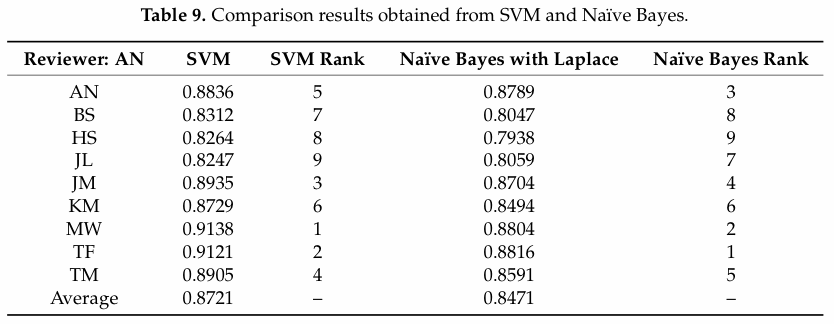
So, the authors focused on the accuracy measure, which is summarized in the table above for each reviewer and method. The authors’ general conclusion is that the reviewers did quite well (>85%) — in other words, they were much more consistent than not.
However, the reviewers did differ notably between each other. For example, Tim Fish and MaryAnn Worobiec produced higher accuracy than did Bruce Sanderson, Harvey Steiman or James Laube. The latter three did not do badly, by any means, but they were less consistent in their use of words to describe wines with a 90+ score.
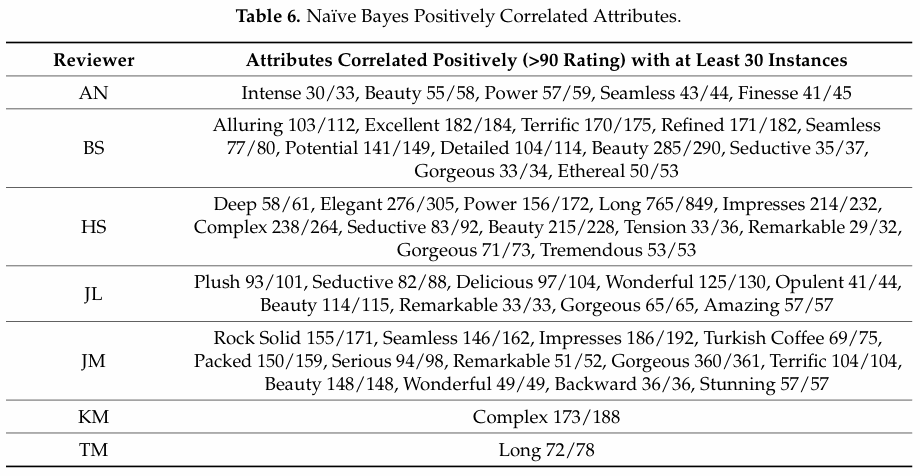
So, what are some of these words that were used consistently to describe highly rated wines? The table below shows some of the words that were used most commonly by each reviewer and could be used to distinguish between 90+ versus 89- wines. The numbers shown for each word are [the number of times used for a 90+ wine] / [the total number of times used]. I do not specifically know why reviewers Tim Fish and MaryAnn Worobiec do not appear in this list.

You can see that these words are often somewhat generic. Furthermore, they are mostly unique to a given person — only “beauty” appears for 5 out of the 7 reviewers, with “gorgeous”, “remarkable”, “seamless” and “seductive” appearing 3 times, and “power”, “terrific” and “wonderful” appearing twice.
What does this all mean?
We may conclude that the consistency of the Wine Spectator reviewers is at least 85%, on average. We can therefore use their word reviews as a guide to high wine quality, because each reviewer is consistent in their use of particular words — these words are not use in an arbitrary manner. In one sense this is not surprising, but in another sense it is good to have it confirmed.
On the other hand, there appears to be little consistency between the reviewers. That is, we have only local consistency, not overall consistency across the magazine. Perhaps we are meant to use the numerical quality score for this purpose, but I discussed above the fact that this is definitely one thing we cannot do. It would therefore be interesting to try combining the data for all of the reviewers, to try to quantify between-person consistency versus within-person consistency.
The authors do not discuss the psychology behind their results. Are some people less consistent because they are prepared to use a bigger vocabulary? Or are they less consistent because of more limited olfactory abilities? Either way, the authors are clearly interested in trying to relate the wine descriptions to physicochemical laboratory data from the wines, in future work.

2 comments for “Wineinformatics: Using Qualitative Measures to Answer Quantitative Questions – A Guest Post by David Morrison”