Hello readers! Just when I told you I was going to start publishing my own original articles again, I give you instead another guest post! David Morrison is our guest writer again today, and may have another guest blog coming in the near future. Don’t worry, I am still coming back—I have lots of articles to read and catch up on! In the meantime, here’s another interesting article from David Morrison!
The following is a guest post by David Morrison. Morrison grew up in Australia. He eventually acquired a PhD degree in plant biology, during which he became interested in wine. He started visiting wineries throughout Australia, just at the time when high-quality wineries were beginning to boom. Somewhere along the line he moved to Sweden, and in his semi-retirement he runs a blog called The Wine Gourd (winegourd.blogspot.com). In the interests of doing something different to every other wine blogger, this blog delves into the world of wine data, instead. He is particularly interested in the relationship of wine quality to price, and quantifying value-for-money wines.
We use numbers to look for trends in data, among their other uses. One of the problems with trends is that we have to compare the numbers, and it is sometimes difficult to make the numbers directly comparable. For example, if we wish to investigate a time trend then we have to compare numbers collected at different times; but how can we be sure that the numbers were all measuring the same thing, at each time point? If they aren’t the same, then we might not be looking at a time trend, but at something else, instead. This is the subject of this post, as related to a couple of topics in the wine world.
Time trends
In the ideal scientific world, when we compare numbers they will be “the same” in all ways except the one we want to study. It is up to us to decide what “the same” means in each individual case. How similar do they need to be? What do we need to do to work out whether the numbers are “the same”? How do we make them “the same” if we discover that they are not? At heart, this is what science is all about.
There are all sorts of things that can affect the comparability of numbers, especially when dealing with time trends. This is especially true if the time involved is quite long. In my own experience as a field biologist, for example, we often had to use what is called “space for time substitution”. This means that we couldn’t follow the trend through time because it involved decades, but sometimes we could find different places that represented different parts of the time sequence — we could then look at the time trend by looking at the different places. The trouble here should be obvious: are we looking at the effect of the different places or the different times? We want the places to be “the same” but not the times. Sorting this out is tricky, believe me!
One of the things that affects the study of time trends is changes in units. Even at an informal level things can change. In a previous blog post (What do wine glasses and hamburgers have in common?) I discussed the fact that, over recent decades, wine glasses have increased in average size, as have serving plates at restaurants, and hamburgers at fast-food chains. So, if you eat “one hamburger” now, then you are getting a lot http://www.academicwino.com/2011/12/presence-of-sugar-in-sparkling-wines.html/more sugar (for example) than you would have from “one hamburger” back in the 1970s, because the serving size is larger now. Many such situations have lead to an increase in portion sizes in the modern world, and this is a contributing factor to what the medical people insist on calling “the obesity epidemic”.
In this particular example we know what is going on — the marketers want us to buy more of their product, and therefore an increase in portion size is desirable for them, even though it is not so good for us. It is deliberately misleading. However, what happens when the misleading effect is not deliberate?
Per capita alcohol consumption
Such a situation, as related to the wine industry, has been reported in the medical literature:
Tanya N. Chikritzhs, Steve J. Allsop, A. Rob Moodie, Wayne D. Hall (2010) Per capita alcohol consumption in Australia: will the real trend please step forward? Medical Journal of Australia 193: 594-597
The authors were trying to estimate the time trend in per capita consumption (PCC) of alcohol for Australians (aged 15 years and older) for the years 1990–91 to 2008–09. However, they found that there had been an under-estimation of the real time trend in the official Australian Bureau of Statistics annual estimates. This had lead to “the mistaken impression that levels of alcohol consumption had been stable since the early 1990s.”
The standard way to work out alcohol consumption is by dividing the number of bottles consumed by the alcohol content of each bottle. Obviously, at the national level this involves the total number of bottles across the country and the average alcohol content of those bottles. However, the assumption when looking at this time trend is that the percentage alcohol level in the bottles has retained the same average through time — this is an essential part of what we mean by “the same” in this particular case.
This assumption is almost always true for spirits, since the alcohol level is determined by the producer as part of the formula for their product. It is by and large true for fortified wines, for the same reason. Beers can differ greatly from each other, but once again the producer has a formula for each beer. However, there is no necessary requirement for this to be true for naturally produced wines. The alcohol content is determined by the yeast and the sugar content of the grape must, with or without some degree of interference from the winemaker.
The point at issue is thus really simple, but not so easy to address. Should we be adjusting the time trend in our consumption calculations for possible increases in average wine-bottle alcohol content over the past few of decades? The authors thought so — “winemakers have increasingly used highly ripened fruit to give a richer flavour to wine; this practice produces more alcohol during fermentation.”
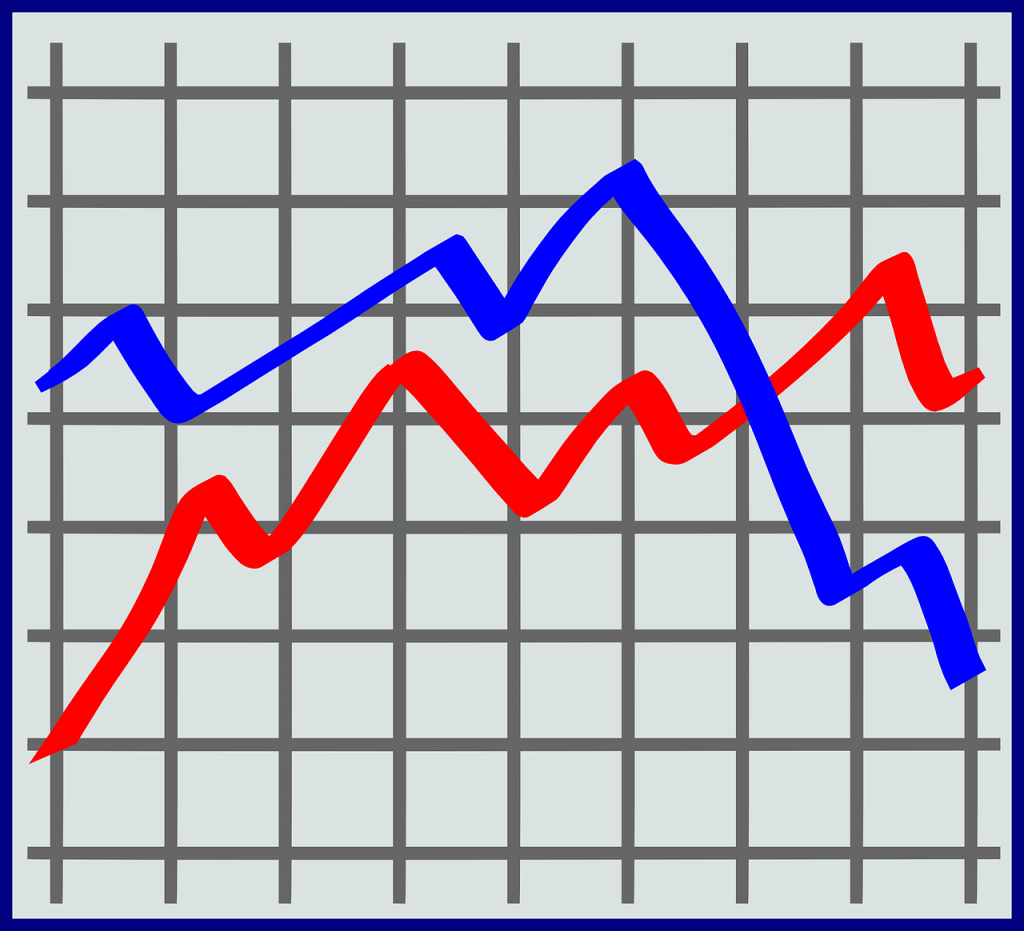
The authors thus performed three different calculations, each based on a different assumption about average alcohol content. These are shown in the graph.
The authors preferred their “Adjusted series”, but included the “New series” because this was the response of the Australian Bureau of Statistics when the authors pointed out the problem to them — they simply changed their assumed percentages as from the year 2003. The old estimates (prior to 2004) of average alcohol content were: table wine (red and white still wine) 10.8%; sparkling and carbonated 10.6%; fortified 17.9%; vermouth 17.3%; and “other” 14.4%. The new estimates (2004 onwards) are: still red and white table wine 13.4% and 12.2%, respectively; sparkling and carbonated 11.2%; fortified 17.9%; vermouth 16.4%; and “other” 14.4%.
The changes for the wine bottles is quite large; and given the number of wine bottles consumd versus the other drink types, this has a large effect on estimated national consumption. The authors’ new conclusion about the time trend is:
“Australia’s total PCC has been increasing significantly over time because of a gradual increase in the alcohol content and market share of wine and is now at one of its highest points since 1991–92. This new information is consistent with evidence of increasing alcohol-related harm and highlights the need for timely and accurate data on alcohol sales and harms across Australia.”
It is important to note that the official statistics were actually changed by the Bureau in response to the authors’ work, as shown on the official website:
Changes in Alcohol Concentration of Wine
The time trend is now much clearer, because the numbers are now much more comparable through time. This need for adjustment obviously apples to all official estimates, in all countries, not just in Australia.
False label claims about alcohol content?
This raises the obvious question about the nature of the actual changes through time in the alcohol content of wines. This question has been addressed by at least one interesting paper:
Julian M. Alston, Kate B. Fuller, James T. Lapsley, George Soleas, Kabir P. Tumber (2015) Splendide mendax: false label claims about high and rising alcohol content of wine. Journal of Wine Economics 10: 275–313. (PDF download)
The authors explored “the high and rising alcohol content of wine and examine incentives for false labeling, including the roles of climate, evolving consumer preferences, and expert ratings.” Here, I will mention their analyses involving the time trend in actual alcohol content, the extent of the discrepancy between the actual and label-stated content, and the effect of climate and price on the stated content.
For their work, the authors used a unique dataset, obtained from The Liquor Control Board of Ontario (LCBO). The LCBO is the sole retailer of wine in Ontario, and it tests every wine imported, recording several characteristics, such as the alcohol content. The authors thus had access to 91,432 complete observations, covering the years 1992-2009, with data on the actual alcohol percentage, the alcohol percentage stated on the label, the vintage year, and the country or region of origin (they started with 127,406 samples, some of which were duplicates or incomplete).
There seems to be no good reason why the LCBO data would not representative of the worldwide wine industry, during the years concerned, as Canada does import wine from a wide variety of countries. (Note: Canada is actually a big wine importing and then re-exporting country, notably to the USA.) However, we do need to be aware that any time-related biases in the importing of wine into Ontario could potentially affect the results and conclusions. Nevertheless, it is unlikely that any better dataset exists, or is likely to exist, with which to examine the study questions.
To quantify the time trend in alcohol content, the authors performed a complex mathematical modeling analysis to tease apart the roles of various factors, including wine type, country, region and a heat index (based on the number of growing degree days). From this analysis they concluded:
“All of the trend coefficients for alcohol are highly statistically significant, indicating growth in the alcohol percentage in every country, but at different rates … The growth rates range between about 0.1 and 1.0 percent per year, implying total growth of 1.5 to 16.0 percent over 16 years (i.e., an increase in the average alcohol content of 0.2–2.0 percentage points on a base of 12–13% by volume).”
The increases were particularly associated with red wines; and the largest increases were noted for South Africa, Spain, Portugal and Chile. The same increasing trends were true for those individual wine-producing regions examined within countries, with Languedoc (France) being high for red wines and British Columbia (Canada) being high for whites. Old World wines were noted to generally have less alcohol than New World wines (0.63 percentage points), on average, although Canada, New Zealand and Portugal produced somewhat lower-alcohol wines, while Australia and the United States produced higher-alcohol wines. White wines also had lower alcohol than reds, as expected.
Importantly, the authors could not attribute much of the increases in alcohol content to increases in climate heat through the studied time period. From their regression model they conclude:
“First, the heat index did not increase by very much in most places, perhaps especially in those places that exhibited the fastest growth in alcohol content of wine (Australia and the United States). Second, the estimated regression coefficient indicates that a very large change in the heat index would be required to bring about an appreciable increase in the alcohol content of wine … a one-degree Fahrenheit increase in the average growing season temperature everywhere in the world would cause the average alcohol content of wine to increase by 0.05 percentage points; it would take a whopping 20 degrees Fahrenheit increase in the average temperature in the growing season to account for a 1 percentage point increase in the average alcohol content of wine.”
So, climate change is having its effect, but it is not enough to explain the obvious increase in average alcohol content throughout the world, over the past couple of decades.
Moving on to the next topic, the legally allowable difference between actual versus label-stated alcohol content, I would love to see a simple graph of the two variables, but the authors do not provide one. Once again, they do a complex modeling analysis to tease apart various factors. They conclude that there are definite geographic trends to the non-random variation in the reported alcohol percentage, although this variation can occur in either direction. They note:
“We observe systematic patterns in the errors: a tendency to overstate the alcohol content for wine that has relatively low actual alcohol, and a tendency to understate the alcohol content for wine that has relatively high alcohol content … It is as though the reported alcohol percentages are biased towards values of 13.0% by volume for Old World red, 12.5% for Old World white, 13.6% for New World red, and 13.1% for New World white. Some of this bias may be the result of rounding actual percentages towards a percentage that is perceived to be more acceptable.”
This ends the discussion of times trends, for the moment. However, the authors pursued an interesting idea in further analyses:
“We speculate that commercial wineries for the most part have relatively precise knowledge of the alcohol content of the wines they produce and that the substantial average errors that we observe are not made unconsciously. This speculation is based in part on discussions with several winemakers who have told us (informally) that they chose to understate the alcohol content on a particular wine label, within the range of error permitted by the law, because they believed that it would be advantageous for marketing the wine to have a stated alcohol content closer to what consumers would expect to find in a high quality wine of the type in question.”
The authors tried to model the idea “that there exists an optimal (i.e., winery-profit-maximizing) or desired value for the stated alcohol content for any wine that is a function of all the other variables”, such as grape variety, geographical region, heat index, and winemaker control of fermentation. This is also related to the price of the final wine. For example: “the intense ripe flavors of wine that are associated with high ratings by some experts and tend to be correlated with higher alcohol content may be less demanded in bulk wines than in premium wines.” Their data analysis of the subset of wines for which they knew the bottle price (17,862 observations) lead them to note that, indeed, “the desired alcohol content of wine increases monotonically with the price”.
The final conclusions are revealing about the cause of the time trends:
“Our analysis of the pattern of discrepancies between label claims and actual alcohol content of wine suggests that in many places the rise in alcohol content of wine is a nuisance consequence of choices made by producers in response to evolving demand for wine having more intense, riper flavors. Specifically, label claims appear to be biased towards a perceived norm, a ‘desired’ alcohol percentage to report for a particular wine — red or white, New World or Old World — with the size of the bias depending on the extent to which the actual alcohol content differs from that norm.
We have suggested that the substantial, pervasive, systematic errors in the stated alcohol percentage of wine are consistent with a model in which winemakers perceive that consumers demand wine with a stated alcohol content that is different from the actual alcohol content, and winemakers err in the direction of providing consumers with what they appear to want. What remains to be resolved is why consumers choose to pay winemakers to lie to them.”
Conclusion
Both of these papers illustrate the point I made at the beginning: we have to be careful when looking at time trends, because other factors may also change through time. In the first case the evaluation of the trend required a set of assumptions about concurrent changes through time that would affect the conclusions, whereas in the second case all of the relevant data were actually collected during the time period covered. The latter case is much closer to what we would like to have in every study; but a dataset like that from the LCBO is very rare, indeed.
3 comments for “Changing Alcohol Consumption: The Real Trend? – A Guest Post by David Morrison (a.k.a. The Wine Gourd)”